Representativeness of Regional Council State of the Environment (SOE) soil quality data set
The representativeness of a data sample can be thought of as how accurately the data reflect all possible relevant data. For instance, if soil samples are intended to characterise all possible soil orders of New Zealand, then a representative sample should contain enough samples within each soil order in proportion to the area each soil order occupies. Further, the procedure for determining whether a data sample covers the whole range of some variable requires that the whole range of that variable is known. For instance, if representativeness is required for soil order over New Zealand, then the coverage of all soil orders over the country is also needed.
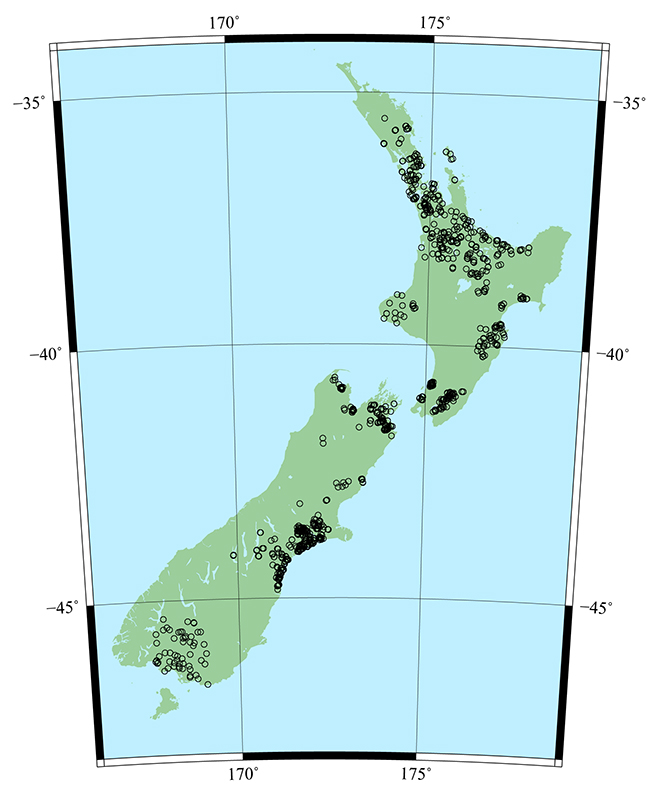
A preliminary assessment of the coverage and representativeness of current soil quality monitoring sites was made on the basis of region, land use, and soil order – the latter two being key factors in the selection of soil quality sampling sites. To do this, regional council data previously provided to Manaaki Whenua – Landcare Research were cross-checked with sampling inventories provided by a recent stocktake of regional council data to generate a spreadsheet that captured all sites used for current soil quality monitoring. Since more recently (i.e. 2015, 2016) established sites did not have locational information, these are excluded from the assessment. The data included sites that had been resampled over time. Locational information was used to identify resampled sites, and only the most recently sampled sites were retained. This resulted in 1,187 sites in the “representativeness” data set, located as shown in Fig. 3, which compares to a total of approximately 1,143 current sites based on the current stocktake. The greater number of sites in Fig. 1 is due to the retention of resampled sites that differed in location by more than 10 m. As soil quality monitoring is currently not undertaken in Gisborne, Manawatū-Whanganui, Otago, or West Coast regions, these regions were automatically excluded.
In addition to the basic site data (land use, location) provided with the data sets, information for each site was extracted on land use (land cover), soil order, and region name from external data sets (LCDB, S-Map and fundamental soil layer (FSL)). Representativeness was determined by a comparison of the expected percentage of the soil quality samples (calculated from the area of a region/soil order/landcover, as a percentage of the total land area), with the actual percentage of soil quality samples calculated from the number of samples from that region/soil order/landcover as a percentage of the total number of samples).
For valid statistical analysis, perfect representativeness across all soil order and/or land-use combinations is not necessarily required. A minimum number of sites are needed to provide sufficient statistical power to determine differences, for example, a relatively rare element (assuming that element is considered important enough to be sampled) may need to be over-represented in the data set. On the other hand, elements that make up a large area can be somewhat under-represented, as there will be enough samples to provide sufficient statistical power. Nonetheless, one implicit requirement for representativeness is that a data sample should be taken from the widest spatial coverage available, rather than close proximity sampling in one region.
To enable assessment of the area for a given land use, landcover classes from the Landcover Database (LCDB) (2012) classes were used. These were aggregated to enable the interpretation of representativeness to be more straightforward. However, there is some difference in classification arising from ‘on the ground’ assessment at the time of sampling and that determined from the LCDB class (Table 1). The greatest ‘misclassification’ arises for dry-stock land use (as determined from ‘on the ground assessment’), with 82 sites being classified as cropping by LCDB. This highlights the challenge faced in aligning different sources of information on land use.
Table 1. Cross-tabulation of on-site classification with that determined from LCDB (number of sites)
| On-site | LCDB | |||||
| Land Use | Cropping | Forestry | Hort. | Native | Other | Pasture |
| Arable Cropping | 216 | 0 | 3 | 0 | 0 | 40 |
| Indigenous/background | 2 | 6 | 0 | 73 | 1 | 20 |
| Dairy | 2 | 1 | 2 | 2 | 2 | 238 |
| Dry-stock | 82 | 5 | 4 | 3 | 1 | 245 |
| Forestry | 1 | 70 | 0 | 0 | 0 | 16 |
| Horticulture Crop | 36 | 0 | 4 | 1 | 1 | 14 |
| Other | 0 | 0 | 1 | 1 | 1 | 1 |
| Pasture | 1 | 0 | 0 | 0 | 0 | 14 |
| Perennial Crop | 3 | 0 | 58 | 1 | 1 | 8 |
| Urban | 0 | 0 | 0 | 1 | 0 | 0 |
On a regional basis, some regions are under-represented (Southland, Northland, Taranaki) while most regions with active soil quality monitoring programmes are over-represented (e.g. Waikato, Wellington, Auckland, Canterbury), and others could arguably be seen as representative with respect to the region (Hawke's Bay, Tasman).
Based on LCDB land cover class, the pattern of the actual sample coverage follows the expected coverage, although there is strong evidence of over-sampling in ‘Cropping’ and ‘Horticulture’, whereas under-sampling is evident in ‘Native’ (Table 2). This reflects the interest in more intensive land uses and potentially a lack of native vegetation areas to sample. Incorporation of indigenous site data from other data sets (e.g. the LUCAS dataset for carbon accounting) into the National Soils Data Repository (NSDR) could be used to fill some of the gaps where data are lacking.
Table 2. Assessment of representativeness of current soil quality sites with respect to land use, as determined from LCDB (2012): comparison of the expected % of samples for that land use based on area and the actual % of samples
| Land cover class | Area km2 | Expected % | Actual % |
| Pasture | 132,924 | 55 | 50.3 |
| Cropping | 3,698 | 1.5 | 29.2 |
| Forestry | 20,406 | 8.4 | 6.9 |
| Native | 81,374 | 33.6 | 6.8 |
| Horticulture | 1,036 | 0.4 | 6.2 |
| Other | 2,399 | 1 | 0.7 |
Based on soil order, over-sampling is evident for all soil orders except Brown soils. For some soil orders (Pallic, Recent), the differences are less marked than for region and land use, perhaps reflecting the complex spread of soil order across regions and land use.
This preliminary analysis highlights that the specific context for determining representativeness is required for its effective determination. With respect to land-use and soil order, extension of this analysis would include its determination based on the combined land use and soil order at a national and regional level, and assessment of the proximity of sampling sites to each other.
JO CAVANAGH, STEPHEN McNEILL, BRYAN STEVENSON
Manaaki Whenua – Landcare Research
E: CavanaghJ@landcareresearch.co.nz
________________________________________
References
Cavanagh JE, Munir K, McNeill S, Stevenson B 2017. Review of soil quality and trace element State of the Environment monitoring programmes. Landcare Research Report for Envirolink Advice Grant 1757-HBRC226.