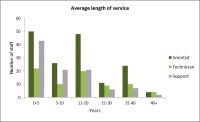
Average length of service
Indicator details
Staff breakdown (by headcount) as at 30th June
| Tenure | Scientist | % | Technician | % | Support | % | Total | % |
|---|---|---|---|---|---|---|---|---|
| 0-5 | 50 | 31% | 22 | 29% | 43 | 43% | 115 | 34% |
| 5-10 | 26 | 16% | 10 | 13% | 21 | 21% | 57 | 17% |
| 11-20 | 48 | 29% | 20 | 27% | 21 | 21% | 89 | 26% |
| 21-30 | 11 | 7% | 9 | 12% | 6 | 6% | 26 | 8% |
| 31-40 | 24 | 15% | 10 | 13% | 7 | 7% | 41 | 12% |
| 40+ | 4 | 2% | 4 | 5% | 2 | 2% | 10 | 3% |
| Total | 163 | 100% | 75 | 100% | 100 | 100% | 338 | 100% |
Covered in reporting?
Yes

