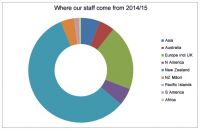
Countries that our employees come from
Indicator details
Where do our employees come from?
| Ethnicity (self-declared) | % | Headcount |
|---|---|---|
| North America | 5.03% | 17 |
| Pacific Islands | 0.30% | 1 |
| South America | 0.59% | 2 |
| Africa | 0.59% | 2 |
| Asia | 5.03% | 17 |
| European (including UK) | 19.53% | 66 |
| Australia | 4.73% | 16 |
| New Zealand | 59.17% | 200 |
| New Zealand - Māori | 4.73% | 16 |
| Not Known | 0.30% | 1 |
| TOTAL | 100.00% | 338 |
Covered in reporting?
Yes

