Issue 3, September 2010
In this issue:
|
Editorial
Irrigation – it is critical to the Government’s goal of increasing productivity in our primary industry-led economy and it will be absolutely essential for sustaining future generations. In the next 40 years we will need to increase food production by 75% if predictions that the world’s population will grow by 50% in that time materialise.
As soil scientist Sam Carrick explains below we have only two options for meeting the increasing demand for freshwater: we can increase water storage and we can improve the efficiency of our irrigation systems.
Improving efficiency is important as irrigation is the biggest user of freshwater. Worldwide irrigation uses 70% of all allocated freshwater, and here in New Zealand the figure is 77%.
I took part in the recent workshop that Sam refers to on improving irrigation efficiency. A key point of discussion was how to increase the rate of uptake of new technologies beyond the ‘early adopters’.
An important emerging issue for water users is not only the efficient use of water but also being seen to be using it responsibly. Water is shaping up as ‘the new carbon’ and future market access for land-derived products, particularly abroad, is likely to depend on a low water footprint – both the water used in creating the products and the environmental impacts from water used in production.
Some would ask ‘why bother?’ when New Zealand primary products already benefit from a perception of comparatively ‘clean and green’ production. But at a time when major retailers around the world are becoming more focused on sustainably produced goods, we have a real opportunity to create a clear point of difference for our products by setting, and demonstrating, new standards in responsible water use.
In this edition we also touch on the other option for better use of freshwater: increasing water storage capacity. Social scientist Shona Russell provides some interesting insights from her work identifying the key social factors for the successful development and governance of new irrigation schemes.
We certainly hope that earthquake damage to irrigation equipment on the Canterbury Plains is not too extensive. It’s has been quite a week for us here in Canterbury!
I hope you find this newsletter interesting. I would welcome any feedback.
Best wishes,
Phil Hart
Land & Water
New tools for improving irrigation efficiency
 The new Soil Mapping Portal will enable users to access a wide range of information based on the soil type in their area of interest.
Efficient use of the soil water resource has considerable potential for improving irrigation systems.
Assuming average soil water storage capacity of 100mm, at any one time the 750,000 ha of irrigated New Zealand land could be storing about 750M m3 of water. Landcare Research’s mapping of soil variability indicates the soil water resource could vary by ±20% (i.e. ±150M m3), making accurate characterisation of the soil water resource a keystone to efficient irrigation.
Accurate soil mapping and the development of other innovative new soil-based tools for improving irrigation efficiency was discussed at a recent Landcare Research workshop.
Ensuring irrigation is optimised to the needs of the crop and the water holding capacity of the soil improves crop production, makes best use of available water, saves electricity and minimises nutrient leaching into ground water.
Interest in efficient irrigation is increasing as demand for freshwater heightens. Landcare Research soil scientist Sam Carrick says the increasing demand for water can be met only two ways: by increasing water storage options – with obvious social and environmental challenges – and through improving our irrigation systems.
Attended by representatives of MAF, MfE, regional councils, industry groups and CRIs, the irrigation efficiency workshop covered improvements in landscape to farm scale tools, such as Landcare Research’s Soil Mapping Portal, as well as paddock scale tools such as electro-magnetic mapping of the variability of soil water holding capacity, precision irrigation technology, and the real time monitoring of soil moisture levels.
Landscape scale tools
Efficient irrigation is dependent on the availability of comprehensive, accurate soil-water information. Landcare Research’s focus has been to make existing landscape scale information easier to access and to develop new information where it is needed.
“We have partnered with the Southland, Otago and Canterbury Regional Councils to make digital soil information online, which has proved popular,” says Dr Carrick, “and we have been working with end users and are now developing an intuitive Soil Mapping Portal that will combine a wide range of soil data with flexible and dynamic information products.”
Demonstrated at the workshop, the new portal infrastructure will largely be operational by the middle of next year, but the completion of all the underlying soil map data is reliant on future funding.
Portal visitors will use an interactive map to click on the soil type in their area of interest. This will take them to a web page for that soil type that includes practical information such as irrigation advice, and agricultural and environmental management information, as well as a soil profile description and other technical information.
We are also continuing to expand S-map, our national soil map database. We have been working to move from regional to farm scale soil maps, and create related information sheets.
We have high quality data on most South Island soils but with the exception of the Bay of Plenty, there is a lot more work to do defining North Island soils. This work involves both converting historical paper maps to digital format, as well as filling in knowledge gaps. In 2011 Wellington Regional Council is funding such a gap-filling project, the mapping of Wairarapa Plains, an area of interest for future irrigation development.
Paddock scale tools
In areas with low soil variability, S-map, with its farm scale data, will provide the necessary soil information. But there are large areas of land with high soil variability where paddock scale mapping may be required to ensure efficient irrigation. On some farms, light soils in one area have less than half the water holding capacity of heavier soils a short distance away.
 |
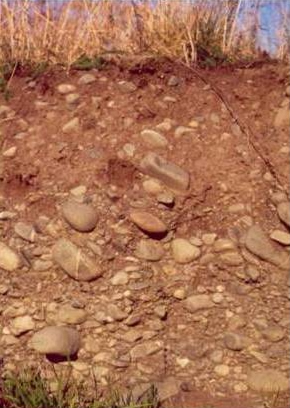 |
| On some farms heavy soils (left) have more than twice the water holding capacity of light soils (right). | |
S-map has the capability to identify the areas of variable soils, and link to relevant information or case studies on options for paddock scale mapping.
A key tool developed through ongoing research by Dr Carolyn Hedley is an electromagnetic sensor, towed behind a GPS-equipped quad bike that enables the creation of an available water holding capacity (AWC) map for the irrigated land. The data is programmed into a variable rate irrigator (as outlined in the first edition of MAF Update) to apply the appropriate amount of water for the crop type and water holding capacity of the soil that the irrigator is passing over. Water savings of 9-21% have been achieved at five trial sites around the country, achieving cost savings of $61-150 per hectare year (based on an estimated cost of $2 per mm/ha).
We are also taking the guesswork out of estimating soil moisture by developing wireless soil moisture sensor networks. The networks enable irrigation scheduling using real time soil water storage measurements in each zone of different water holding capacity by feeding the information back to the variable rate irrigator.
“If farmers are over-irrigating by just .5mm per day across the entire area of currently irrigated land in New Zealand then we are wasting 150M cubic metres of water per year. We can stop trying to estimate the impossible and accurately measure soil water storage in real time.
“In summary we have the technology to improve current irrigation practices. Irrigation based on real time soil water storage data enables us to save water and allow new water allocation, increase profitability and reduce drainage and ground water pollution.”
Measuring drainage
An innovative new lysimeter for measuring drainage from soils was also explained at the seminar.
“There is a real need for a low-cost, low-maintenance tool farmers can use to measure drainage,” says Dr Carrick. “We are developing a new design that is accurate, inexpensive, and simple to install and maintain. It is valid for different land uses and soils, and enables real time monitoring of irrigation and nitrate leaching.”
Further information:
Sam Carrick
Governance for success in irrigation development
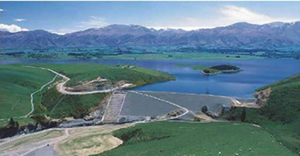 A recent announcement of $739,000 of Government funding for irrigation projects, including a ‘how to guide’ for the development of water user groups, has again placed the public spotlight on water resources and water allocation.
As proposals develop with Government support, Landcare Research researchers have been investigating the key social factors for getting new irrigation schemes underway and the important ingredients for effective governance.
Earlier this year the researchers interviewed people connected with five irrigation organisations in Canterbury and Otago; the Kakanui Water Allocation Committee, the Maniototo Irrigation Company, the Te Ngawai Water Users Group, the Opuha Water Partnership, and the Ashburton–Lyndhurst Irrigation Company. These groups were selected to reflect a range of ages, sizes, histories and origins.
Researchers interviewed farmer leaders in each group as well as liaison and regulatory staff in the Otago and Canterbury regional councils, and staff and office holders of third-party organisations that were required by consent condition or other legal arrangement to work with the irrigation organisations.
From these interviews a set of ‘factors’ emerged that are needed for the effective operation of these voluntary water sharing or communal irrigation schemes. These conditions seem to us to be important ingredients for the further development and effective operation of the self-management model in both regions.
The factors are:
- Community-based leadership
- Local identity
- Shared knowledge
- Reliable and up-to-date information
- Good relationships with regulators
1. Community-based leadership
Wisdom and judgement are essential in governance together with an ability to ‘take people along’ in a constructive and cooperative process. In all the cases studied, one individual or a small group of people have ‘put their hand up’ to take a decision or to guide or lead a group to a decision. Support is also needed from central or local government. The leader adds credibility to the group and this helps with engagement with the community and regulator.
2. Local identity
Where landowners/irrigators have a strong sense of place and identify with an area, its history and its land and rivers, governance arrangements and management decisions relating to that place and those resources are more likely to reflect the long-term needs of the community. Other users of the area, principally of the rivers, may also identify strongly with the area, laying the foundation for partnership around common goals. The arrival of new owners without local history and with different farming experience can threaten or destabilise both internal and external relationships, at least in the short term.
3. Shared knowledge
Stakeholders must have a good understanding of each others’ issues and concerns. This involves a shared knowledge of the different factors that bear upon a scheme such as land use (and misuse), water quality, ecology, and recreation. This aspect is the most visible and was common to the case studies, and includes recognition of the values of the local iwi.
Sharing of experiences is also an important trust-building factor and is time dependent. Eighteen months is reported in three case studies as the time span for meetings, information sharing and discussion to deliver marked benefits in compromise and concession between different interest groups.
4. Reliable and up-to-date information
Irrigators, regulators and stakeholders recognise the need for accurate information on water application and current and forecast water availability. Improving standards of measuring monitoring and reporting by all parties involved in water management and water use will lead to increased confidence in the data, and science, used to inform decision-making around water allocation and environmental flows.
5. Good relationships with regulators
A key challenge is establishing and maintaining empathy and trust between the individualistic and self-reliant farmers and the rule and regulation-focused regional council. The involvement of regional council field officers constructively bridges these divides.
Trust relationships are central to the effective operation of communal irrigation schemes. This was highlighted in many of the interviews and was a central theme regarding relationships between irrigation scheme members and their leaders, with external stakeholders, and with regulators.
Increased trust between those involved directly in irrigation schemes, and regulators and stakeholders, is increasingly recognised to shorten the consenting process and reduce the risk of litigation.
Further information:
Shona Russell
How increased fertiliser leads to increased nitrogen leaching on hill country pasture
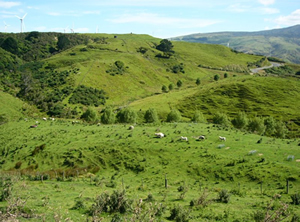 A major gap in understanding nitrogen (N) and phosphorus (P) leaching in hill country pasture is being filled by a Landcare Research study at AgResearch’s Ballantrae research farm near Palmerston North. The research is studying the effects of fertiliser, herbicide and grazing management on plant and soil communities.
Significantly, the research is suggesting that the shift from fungal to bacterial pathways, which comes about from increased N input, may lead to soil microbial-microfaunal interactions that retain less reactive N in the soil microbial biomass, hence the greater risk of N loss. Dr Roger Parfitt explains.
Increases in fertiliser inputs and livestock numbers affect plant species composition and richness; this in turn can affect the biodiversity of soil fauna and nutrient cycling in pastures.
We have been studying differences between low fertility (LF) and high fertility (HF) soils at AgResearch Ballantrae and have estimated N and P losses under sheep-grazed pastures at two stages of N saturation.
In winter, seepage zones in mini-catchments in each farmlet generated waters that allowed us to follow nutrient movement from soils to waters. Winter 2006 had above average rainfall, with one intense storm where surface runoff was observed. During other storms, water perched at about 300mm depth in the subsoil, and moved to seeps solely by subsurface runoff.
Mean nitrate-N concentration in drainage at HF was highest in 2006, as were surface and subsurface runoff, giving a calculated annual loss of nitrate-N of 44 kg N ha-1, compared with 20 kg N ha-1 in 2005 and 27 kg N ha-1 in 2007. At LF the losses ranged from 1-2 kg N ha-1.
P losses increased considerably during surface runoff. Annual losses for dissolved reactive P in drainage were 1.0 at HF and 0.3 kg ha-1 at LF.
Losses for dissolved organic N (DON) were 8 and 4 kg ha-1 and for dissolved organic C (DOC) were 120 and 230 kg ha-1 at HF and LF. The DOC/DON ratio was lower at HF (16) than at LF (54).
In the plots with 300kg N added, soil N status increased at LF and losses increased from 2 to 14 kg N ha-1 y-1 at 200 mm depth; losses at HF were over 80 kg N ha-1 y-1.
This suggests that soils on these slopes in the HF farmlet have become saturated with N and no longer retain N; soils in the LF farmlet appeared to retain N fertiliser initially but after 2 years they appeared to become saturated with N. Gaseous emissions of ammonia, NOx and N2 would also increase as pastures and soils become enriched with N. The OVERSEER® nutrient budgets model gave good predictions of N in waters.
The effects on most of the soil biochemical and biological properties varied between years. This may have partly arisen from an infestation with Wiseana caterpillars in the first winter, causing resources to be low and total soil carbon (C) to be reduced by 4–8%; total C did, however, recover in later years.
The 300kg N caused greater changes aboveground than belowground, but did reduce soil microbial C and N and nematode diversity. On an area basis, HF generally had higher total C and N, earthworm and nematode numbers (including bacterial feeders, predators and omnivores), and nematode diversity, than did LF.
In contrast, the total mite numbers and fungal-feeding nematode numbers were higher at LF than at HF. Increased quantity and quality of inputs disadvantaged the fungal-based energy channel, with a measurable decline in the quantity of fungal phospholipid fatty acids (PLFAs). While the quantity of bacterial PLFAs appeared to be unaffected by greater plant-derived inputs, the greater numbers of bacterial-feeding nematodes at the HF farmlet suggests the activity and flow of energy and nutrients through the bacterial community would be more important in the HF than the LF farmlet.
Overall our results suggest the shift from fungal to bacterial pathways may lead to soil microbial/microfaunal interactions that retain less reactive N within soil biomass, with a consequent greater risk of N loss.
Further information:
Roger Parfitt
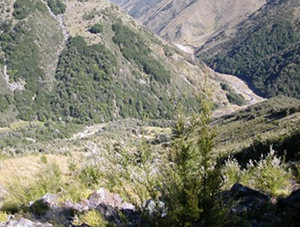
Land use change in the South Island tussock grasslands
The tussock grasslands in the South Island have typically provided broadsweeping and natural landscapes, both for recreationalists and low-intensity graziers. These landscapes have provided a wide range of ecosystem services to humans, from food and fibre, water regulation, natural habitat provision, through to recreation and tourism, and cultural services.
In recent years, this balance has been changing, due to intensification of agriculture. New irrigation schemes are offering the possibility of more intensive grazing on usually dryland soils, and the tenure review is promoting destocking of highlands in return for intensification of lowlands.
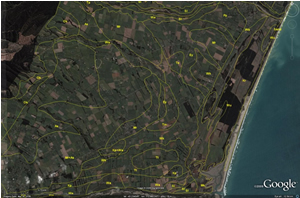
Ph.D. student Emily Weeks has been investigating land-use changes in the tussock grasslands. She has used satellite imagery to map changes between 1990 and 2008. The figure shows the changes to the 4 million hectares of tussock grasslands in the South Island. One million hectares of tussock grasslands has been converted to exotic pastures prior to 1990 (shown in yellow). Another 38,000 hectares was converted between 1990 and 2001 (shown in blue). A further 31,000 hectares was converted between 2001 and 2008.
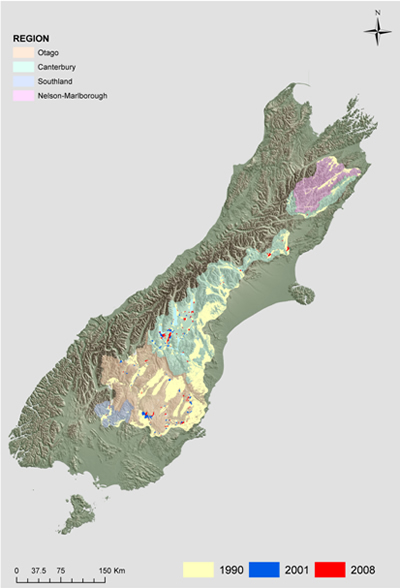
The results of her work will be used by the FRST-funded Ecosystem Services Program for Multiple Outcomes to help evaluate the conditions and trends of all the ecosystem services in the tussock grasslands.
Emily is located at Landcare Research, Palmerston North. She is supervised by Bruce Clarkson (Waikato University), and Susan Walker, John Dymond, and James Shepherd (all of Landcare Research).
Further information:
Emily Weeks
Trees for Bees promoting healthy bees
 Landcare Research has teamed up with Federated Farmers to highlight the importance of bees to New Zealand agriculture and encourage better bee health on our farms and better pollination of crops.
The ‘Trees for Bees’ campaign initiated by Federated Farmers provides information for farmers and the general public on native and exotic shrubs and trees that help keep bees healthy with nutritious pollen and nectar.
Landcare Research scientist Dr Linda Newstrom-Lloyd says the honey bee is in trouble.
“Worldwide, bee numbers are declining. The honey bee is being attacked by an increasing number of pests (e.g. varroa mite) and diseases. A severe decline in floral resources is creating a shortage of quality pollen for the bees to eat. Malnutrition severely compromises the bees’ resistance to pests and diseases.”
Bee pollination of crops like kiwifruit, avocados and apples is estimated to be worth $3.5 billion dollars a year to the New Zealand economy.
A series of ten regional Bee Plant Guides has been created that list some of the most popular and appropriate plants for improving bee health. The guides have been created from Landcare Research’s databases on New Zealand Flora and Dr Newstrom-Lloyd’s research on native and exotic plants that are attractive to honey bees.
There has been strong interest in the regional guides since the Trees for Bees programme was launched late last year.
“When choosing what to plant in waterway margins, windbreaks, along roadsides and other parts of their property farmers can now choose bee-friendly trees and shrubs,” says John Hartnell, chairman of the Federated Farmers Bees group.
“Many shelter and erosion control plants also produce abundant flowers to feed bees so choosing multi-purpose plants is smart farming for healthy bees.”
Dr Newstrom-Lloyd says it’s important to choose plants with high quality pollen for protein and vitamins, as well as plants with lots of nectar for energy.
“Pollen provides protein to produce healthy adult bees and develop more brood. Nectar is like flight fuel for bees and the surplus is transformed into honey and stored by bees. The key is to provide diverse and nutritious pollen and nectar sources and to sequence the flowering times to keep the bees well nourished throughout the seasons.”
Further information:
Linda Newstrom-Lloyd
Website: Trees for Bees
Website: Federated Farmers Trees for Bees
Weeds & Pests
The role of genetics in managing emerging pest plants
 New research into the genetics of emerging weeds has posed interesting questions about exactly what happens when a new plants species is introduced into New Zealand. Landcare Research scientist Dr Gary Houliston explains.
While much of our country’s focus in combating weeds is on effective border control, New Zealand already has about 2500 naturalised plants - about 700 of which are classified as weeds or emerging weeds.
Often there is a ‘lag time’ of tens or even hundreds of years between an introduced plant getting established and it becoming a serious threat.
Despite this we have a poor understanding of the ecological and evolutionary processes between naturalisation and ‘weediness’. Reconstructing the introduction of a plant that is emerging from the lag phase and becoming a serious threat is a key step in creating the understanding to develop strategies for preventing or managing invasions.
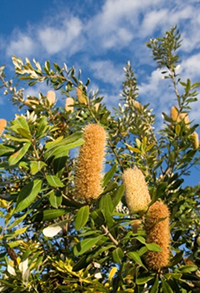
Recently we studied two trans-Tasman visitors that are emerging as serious threats here in New Zealand: the Coastal Banksia (Banksia integrifolia) and the Alpine Wattle (Acacia pravissima). We compared the population genetics in the plants’ native ranges in Australia with both the cultivated and naturalised populations in New Zealand.
By comparing the amount of genetic variation in naturalised and native species, we may gain insights into what factors determine the success of new invaders.
They key initial finding in the study of Coastal Banksia was a surprising amount of genetic variation in the naturalised plants here. With an introduced plant, especially one cultivated for sale, we would anticipate considerably less genetic variation than in the plant’s native range, although up until now this has been an assumption. Theory would predict that if there is more genetic variation introduced into a new range, there would be more chance of there being a genotype suited to the local environment.
The genetic variety of these naturalised plants raises interesting questions about what we are actually introducing when plants are brought into the country. Introductions have been based on the species of the plant but there has been scant attention to the amount of variation introduced or cultivated here.
The Banksia research has provided valuable information for justifying the classification of this emerging weed. This lack of evidence to-date has resulted in one North Island regional council having propagation restrictions on Coastal Banksia while a neighbouring authority is actively planting it in reserves.
An interesting aside was the comparison of the health of Coastal Banksia trees on both sides of the Tasman. The tree has a wide native range in Australia but in some parts of that country it has been so badly ravaged by disease and predators that it is difficult to find a healthy specimen. In New Zealand, where introduced plants would have undergone phytosanitary inspections prior to introduction, and where the tree has few natural predators, it is flourishing.
Our study of the genetic variations of naturalised Alpine Wattle trees also showed considerable variety, although less than for the Coastal Banksia. It is clear in both cases that multiple source populations were likely to establish the variation present in New Zealand.
The Alpine Wattle is starting to pose a serious threat here in New Zealand. This plant has the potential to spread into important New Zealand ecosystems, such as braided rivers, and there are naturalising populations close to the Waimakariri River at present. Significant soil disturbance, as there is in a riverbed, is likely to be favourable to such species.
The banksia and acacia genetic research has been used as a baseline for new collaborative research with Lincoln University on the factors that may predict weed success in cultivated brassica species.
Further information:
Gary Houliston
Carbon storage
Soil carbon loss under dairy farms
The amount of soil carbon lost under dairy farms appears to have slowed in the last five years, according to soil scientists from Landcare Research, GNS and University of Waikato, who have been studying changes in soil organic matter under pasture. Dr Roger Parfitt explains.
We have measured soil carbon (C), as an assessment of soil organic matter, under pasture on three occasions over the last 27 years at dairy farms and sheep/beef farms. We previously reported the changes in soil C between 1982 and 2004 for 30 sites where we found that it was decreasing by 0.8 tonnes C/ha/year for the whole soil profile.
International reporting (IPCC) requires that we report for a soil depth of 0-30cm.
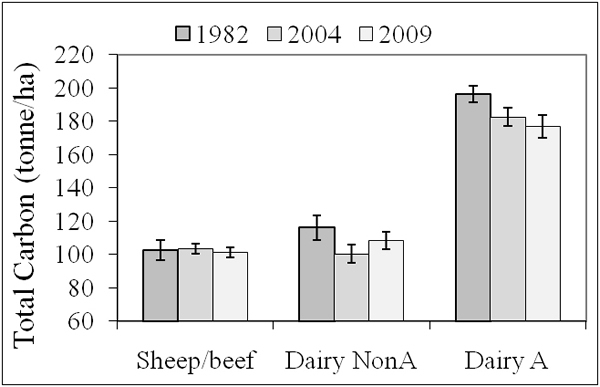
We now have data for 83 sites, and we found that for sheep and beef farms there was no measurable loss of soil C over the last 22 years (Figure 1); the average total soil C in 1982 was 132 T/ha and for 2004 was 128 T/ha (this small change was not statistically different). But for dairy farming there was a significant loss of 0.7 T C/ha/year for 29 dairy sites.
When we separated the non-Allophanic soils from the Allophanic soils (Taranaki and Waikato) the average losses were similar although the non-Allophanic soils contain less total C (122 T/ha to 105 T/ha) compared with Allophanic soils (194 T/ha to 176 T/ha) (Figure 1).
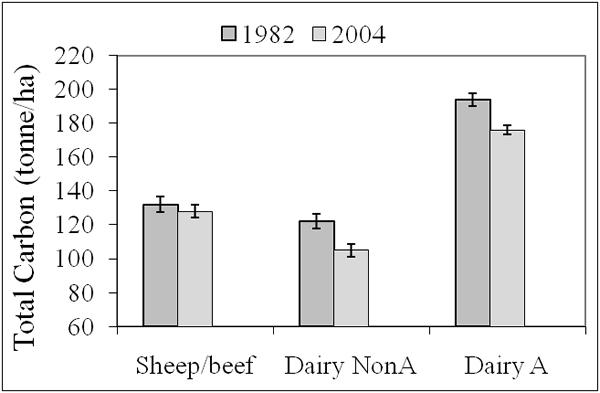 |
| Figure 1. Soil carbon at sheep/beef farms, and dairy farms on Non-Allophanic Soils (NonA) and Allophanic soils in Taranaki and Waikato (A) for 0-30 cm depth for 83 sites. Error bars are standard error of the mean. The years actually have a range and the Figure is illustrative. |
We also have preliminary soil C data for 2009 from 22 farms (Figure 2). They indicate no further measurable loss of C between 2004 and 2009; however, insufficient time has passed to be able to detect ongoing change in soil C stocks, because of the considerable variability in soil C within a paddock. We are investigating how many sites need to be measured, over how many years, in order to get a robust measure of change in soil C.
 |
| Figure 2. Soil carbon at sheep/beef farms, and dairy farms on Non-Allophanic Soils (NonA) and Allophanic soils in Taranaki and Waikato (A) for 0-30 cm depth for 22 sites. Error bars are standard error of the mean. |
The possible reasons for the loss of soil C under dairying also are being investigated. The use of N fertiliser increased from 1990 to 2004 (Figure 3) mainly on dairy farms, and over this time pasture has been farmed more intensively. For dairy pastures, the soil C:N ratio appeared to decrease from 11.4 to 11.1 suggesting that soil N fertility was increasing.
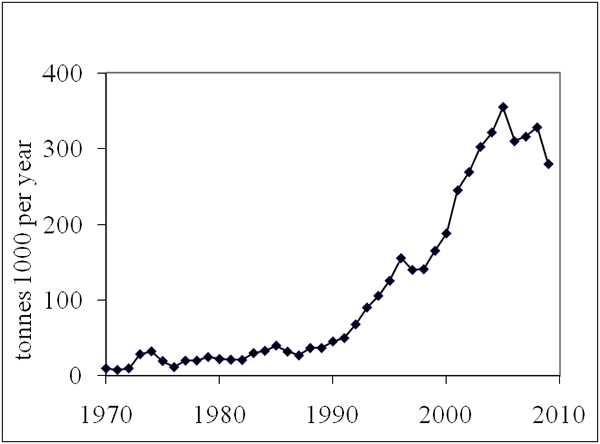 |
| Figure 3. N Fertiliser consumed in NZ (H. Furness). |
With increased N input, there may be less C input from roots to soil, and there will be greater additions of cow urine-N to the soil. Preliminary work suggests that cow urine can accelerate decomposition of soil organic matter. Therefore the intensive use of pasture under dairying may contribute to the loss of C.
Since 2004 the use of N fertiliser has not increased but it is probably too early to say whether soil C has arrived at a new level.
Further information:
Roger Parfitt
Indigenous forest carbon sequestration – answering the big questions
 How much carbon is stored in our native vegetation? How quickly is it currently accumulating? How is that likely to change in future? And how could indigenous forests be managed to optimise carbon sequestration?
Recently MAF International Policy contracted Landcare Research to provide answers to these questions, to help New Zealand meet its climate change responsibilities.
Landcare Research scientist Dr Robert Holdaway, who is leading the work, says detailed empirical data and supporting modelling exist for exotic production forests but the information for indigenous forests is much less clear.
To quantify and evaluate the actual carbon stocks by current native vegetation type and by region, Robert and his colleagues are using LUCAS (the Land Use and Carbon Analysis System) data from the National Vegetation Survey (NVS) database.
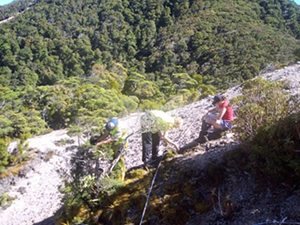 LUCAS has a total of 1372 permanent carbon monitoring plots based on an 8 km grid across the New Zealand landscape, with plots located on all grid intersections with land-use classified as indigenous forest or shrubland according to the New Zealand Land Cover Database 1 (LCDB1). The entire plot network was measured between 2002 and 2007.
Calculations of stored carbon will take into account carbon in live biomass of tree stems, branches, roots, standing dead stems, coarse wood debris and shrubs.
Earlier research has shown that anthropogenic or human-induced disturbance (e.g., logging, clearing, and burning) has produced a significant shift in the composition and age-structure of many New Zealand forests towards young or regenerating forest types. Such forests are likely to have less carbon (on average) than forests affected by purely natural disturbance (e.g., storms, earthquakes). While the natural disturbance is unavoidable, proper forest management could remove the effect of human disturbance.
A mix of plot measurements and satellite data are being used to directly quantify the effect of human disturbance on total carbon content. Plot-based variables include the presence/absence of grazing (managed stock only), clearing, mining, fire, logging, and the presence of tracks. The satellite data will be used to assess the level of “naturalness” of the vegetation cover at each location. The two complementary approaches will then be used to model potential carbon stocks in the absence of all such disturbances.
There is little explicit information about the consequences of management in terms of carbon sequestration rates so work in this area will still be somewhat speculative as the researchers focus on determining the scale at which optimal management could maximize gains or minimize losses in C sequestration (beyond current management) over the next couple of decades.
The team is modelling changes in carbon stock between 2010 and 2022 for each LUCAS plot assuming no dispersal or human-induced limitation on seedling establishment, i.e. species are free to establish whenever the local conditions are suitable. Rates of sequestration derived from these models represent a conservative upper limit of what is achievable through optimal management. Conservative criteria are then being used to assess likelihood of regeneration under current management. These include the presence of tree species capable of growing >5m tall with a combined cover score of >5%, absence of managed grazing, absence of historical ‘fire’ and ‘clearing’, and the current land-use excludes fire and clearing as common practice. Land tenure information (DOC/private ownership) was used to assess this last factor, since clearing and burning are not common management activities on conservation land, whereas they are a common part of agricultural management.
Plots not currently regenerating were assessed in terms of the scale of management changes required to achieve optimal sequestration rates. ‘Optimum’ management activities can be grouped into three categories based on the intensity of human intervention required:
- land-use change with no direct intervention
- adoption of basic permanent forest management practices
- fencing and removal of stock
- halting all periodic burning / clearing
- minor pest and weed control where appropriate
- periodic or low intensity intervention
- collecting and spreading seed to aid establishment of key species (e.g., kanuka, beech)
- intensive grazing prior to heavy seeding to encourage tree seedling establishment
- creating small scale regeneration gaps (e.g., through spot spraying or scarification to remove grass sward)
- intensive human intervention
- extensive seeding and planting of key tree species
- Continuous management (e.g. watering, intensive weed and animal pest control) to ensure successful establishment.
Key results will include national-level predictions of short-term sequestration rates in existing indigenous forest and shrubland under both current and optimal management.
The research will better enable officials to make an informed decision about ‘business as usual’ sequestration in indigenous forests, what actions are needed to increase the sequestration to optimal levels, and what the risks of reversals are.
Further information:
Robert Holdaway
Steven Cox, MAF
Final thoughts
- New Zealand farmers should view the environment as a strategic asset and a source of long-term competitive advantage, Landcare Research Chief Executive Warren Parker wrote in this article in a recent edition of NZ Dairy Farmer.
- What is the value of biodiversity to a farmer? Should individual landowners or the community take responsibility for protecting it? Landcare Research Science Leader Matt McGlone wrote this article for a recent edition of NZ Dairy Exporter.