Issue 4, January 2011
News about Landcare Research science relevant to the Ministry of Agriculture and Forestry.
In this issue:
|
Editorial
A sagacious old colleague of mine used to reflect that if work was easy, they wouldn’t call it work!
At Landcare Research our work is often at the forefront of difficult, challenging issues and in this edition of our newsletter there are ample examples of that.
The contentious issue of dairy farming on light stony soils, such as in the Mackenzie Basin has been the centre of heated recent discussion. Here we outline research we are undertaking on the application of dairy effluent to various soil cores taken from Pukaki Airport. The results will be eagerly awaited.
And then there’s the difficulty of incorporating European and Māori perspectives in resource management decision making. Our 10-year Integrated Catchment Management (ICM) research programme on the Motueka River made significant developments in this area, and the learnings are now being applied elsewhere in the country.
We also report on two easy-to-use and interactive new online tools in the battle against two of rural New Zealand’s most pressing challenges: limiting the spread of weeds and managing vertebrate pests.
One is a Weed Identification Key, allowing you to identify weeds from up to 47 characteristics. The other is a Decision Support System for managing vertebrate pests that effectively replicates the thinking of an experienced, well-informed pest manager. A tool like that is useful even for experienced personnel because it can provide assurances that limited vertebrate pest management funding is being applied prudently.
All the best for 2011. May it be a year of surmountable challenges. We look forward to assisting with many of them.
Regards,
Phil Hart
Land & Water
Mapping irrigated land
How much irrigable land is there in New Zealand? Where is the growth occurring? Where will we need additional water storage?
Landcare Research has provided some answers to these important questions for central and regional government by mapping New Zealand’s irrigable land.
There is about 600,000ha of irrigable land in New Zealand, a figure that has increased rapidly in recent years. The area of land that can be irrigated is now reaching near total allocation, raising significant issue for decision makers.
The pressure on water use also means that tools for improving efficiency of use are needed. A map of irrigated land combined with a soil map will help optimise water use.
However, although farmers are well aware of where the irrigated land is, mapping at regional or national scale is not trivial. Regional councils hold information on the consented areas for extracting water from rivers or groundwater, but that doesn’t say how much of this water is actually used in any one year. In addition, water could be extracted in areas away from consented locations.
Landcare Research estimated the area of irrigable land by overlaying information on farm boundaries and resource consent locations. This exercise was done in five regions (Manawatu, Hawkes Bay, Wellington, Otago and Canterbury). But, this only estimates the potential for irrigation, not active irrigation. Satellite images can be used to detect greenness of the land and pivot irrigators. This information shows where irrigation actually occurs.
We tested this approach in two regions, Manawatu-Wanganui and Hawkes Bay, and used mosaics of Landsat ETM+ images acquired in 2001 and SPOT 5 images acquired in summer 2008. By overlaying the farms with freshwater resource consents for irrigation, we were visually interpreting the landscape to determine if the land was irrigated or not.
This preliminary study showed that the accuracy of the mapping relies heavily on the acquisition dates of the images. As shown on figure 1, the irrigated land was interpretable where the land was dry enough to distinguish greenness due to irrigation from greenness due to naturally lush pastures.
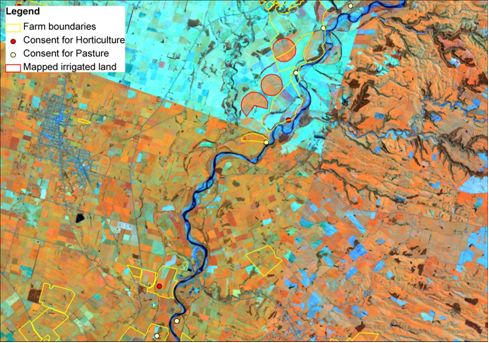 |
| Figure 1. An example of irrigated land (red line) mapped on a mosaic of SPOT images in false colours. Cyan colour represents bare ground (dry or ploughed fields, cities, roads), shades of orange represents levels of green pasture. The upper part of the mosaic was taken from imagery during a dry period. |
In the future, Landcare Research envisages developing a two-level approach:
- At the national scale, we can produce a map using a national database of resource consents compiled by MfE and farm boundaries. We can improve on the methodology by using simple rules to calculate the effective irrigated area in each property based on consented volume per day, and by removing obvious non-irrigated areas (e.g. uplands).
- At the regional scale, we can use satellite images to visually interpret irrigated land. We can identify the appropriate high resolution satellite imagery by assessing driest period using NIWA soil moisture deficit archives. Using any other ancillary information (aerial photos, GoogleEarth, regional council information), we can build on our previous experience to produce a 1:50,000 scale map of current irrigation.
Further information:
Carolyn Hedley
Anne-Gaelle Ausseil
How do stony soils cope with dairy shed effluent?
 Landcare Research is studying the ability of stony soils, such as those found in the Mackenzie Basin, to handle dairy shed effluent.
Over the last 15 years Landcare Research has developed a good understanding of how different soils treat microbes in dairy shed effluent that is applied to the soil’s surface.
Central to this research is the use of lysimeters - undisturbed soil cores in purpose-built barrels. Dairy shed effluent and artificial rainfall is irrigated onto the soil core, and the leachate is analysed for microbial indicators.
Not surprisingly, the microbial load in dairy shed effluent is very high. Soil Scientist Malcolm McLeod has found that the leachate from some soils contained microbial loads nearly as great as in the irrigated dairy shed effluent. On the other hand, microbes were not detected in the leachate from some other New Zealand soils. This suggests some soils play a significant role in moderating the microbial load that can potentially reach shallow groundwater or surface water, while others have little effect.
A nice friable soil will retain microbes but a clayey soil with many cracks will allow microbes to leach quickly through the soil.
Landcare Research soil scientists have produced a general map for all of New Zealand showing if and where soils are “leaky” to microbes or retained within the soil. The longer that microbes can be retained in the soil the better the chance for them to die-off by desiccation or be eaten by other ‘mini animals' in the soil.
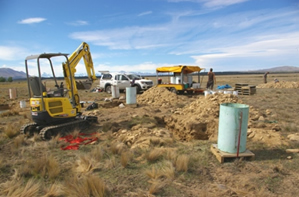
The map also revealed a general lack of knowledge about stony soils. To remedy this, Malcolm and other Hamilton-based colleagues went to Pukaki Airport in the heart of the Mackenzie Basin to collect cores from a series of sites that had stones at the surface, stones starting at 30 cm depth and stones starting at 50 cm depth. Four replicate undisturbed cores, 50cms in diameter and 70cms high, from each soil type were collected. These oil cores have now been transported to the laboratory in Hamilton in preparation for being irrigated with dairy shed effluent.
Malcolm says that with the spread of dairying to areas with poorer quality soils, such as the Mackenzie Basin, there is keen interest in the results of the research.
This work was funded by a FRST Sustaining Soil Services contract.
Further information:
Malcolm McLeod
Installation Costs of Variable Rate Irrigation and Moisture Sensor Networks
 Innovative new developments with Precision Irrigation were outlined in the first edition of MAF Update. Since then we’ve been looking at where the technology can best be applied and how much it will cost.
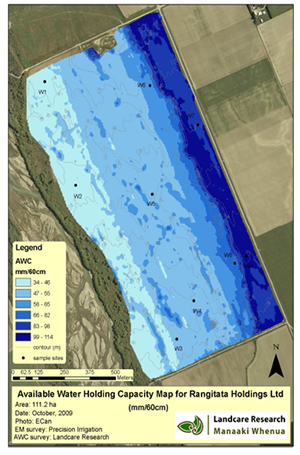
With Precision Irrigation, an irrigable area is mapped with an electro-magnetic sensor to accurately determine the available water holding capacity (AWC) of the soil.
That data is programmed into the software that drives the scheduling on a variable rate irrigator (VRI) - an irrigator which has individual sprinkler control, allowing water to be delivered at variable rates along its length.
Soil zones are irrigated to their specific irrigation trigger points, which saves water and also reduces the risks of drainage and runoff.
Landcare Research has developed a wireless moisture sensor network (MSN) to provide daily soil moisture updates in each zone. This information is uploaded in real time, via a remote computer, to the software that drives the irrigation scheduling on the irrigator.
Variable rate irrigation is of greatest benefit where soils under one irrigator are highly variable. However a variable rate irrigation system can also be used for mixed cropping under one system and can be switched off over exclusion zones, such as drains and raceways. It can also be used for site specific chemigation and fertigation, and on a dairy farm for variable wide distribution of dairy effluent. Under- or over- irrigation of parts of the farm is minimised which has significant financial and environmental benefits.
So when is it worthwhile to commit to Precision Irrigation by fitting variable rate technology to a new or existing centre-pivot or lateral sprinkler irrigators, and installing an MSN?
We estimate the installation cost at present is:
| Task | Unit cost | Cost for a 200 ha farm |
| Modification of existing irrigator | $100/metre |
$40,000 |
| Electro-magnetic map | $50/ha | 10,000 |
| AWC map | $90/ha | 18,000 |
| Wireless MSN (approximately 9 nodes) | $1,500/node | $15,000 - $20,000 |
| Total | $83,000 - $88,000 |
Note that when many farms are converted to variable rate irrigation in one area, there will be significant savings, as AWC results can be extrapolated across the landscape.
We also envisage that the cost of VRI modification and Wireless MSNs will reduce significantly as demand increases, and these technologies move from prototype to commercial products. Wireless MSN is a rapidly advancing technology, costs are reducing and Landcare Research’s aim is to build a customised system for 50% of the off-the-shelf price.
It is estimated that the water and associated energy savings will be significant. A study of the potential savings of varying irrigation according to soil differences on six farms gave cost savings of $60-150/ha/yr based on the amount of water saved, with a typical cost of irrigation estimated to be $2/mm/ha.
The modelling study also found that runoff and drainage was reduced by up to 55% at these six sites for the period of study (2004-2008). Where water is restricted the saved water (typically 5-15%) can be redirected elsewhere giving improved water productivity (kg dry matter production per millimetre irrigation applied).
The map below shows all the dairy farms in the Central Plains area. The red colour indicates the dairy farmland areas that are on highly variable soils that will gain the most from VRI & MSN technology. The range of variability on the yellow soils is very short (< 50m) so is not as practical for VRI. The purple areas are shallow or stony soils with a low AWC that could benefit from precise, frequent, low depth irrigation. The lighter purple soils are more spatially uniform but the darker purple areas are less uniform and may benefit from VRI. If the water holding capacity of these soils does not vary by more than 50mm our research shows that water savings are likely to be less than 10%. At these sites VRI technology would be useful to shut-off water over exclusion zones, for better control of application at either end of a pivot, and for mixed cropping. This year on one dairy farm, irrigation was switched off over the paddocks where grass was being renovated until the new grass started to emerge.
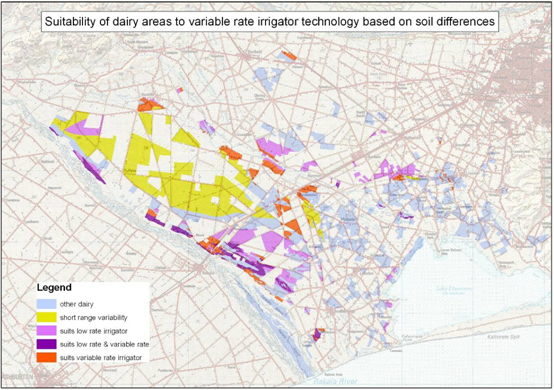
| Soils which will gain the most from VRI | Area |
| Soils with a low AWC (need more precise irrigation to avoid leaching) | 7,647 ha |
| Highly variable soils (need variable irrigation) | 3,145 ha |
Our analysis also shows a significant area of very shallow soils (i.e., the low AWC or purple areas on the map). Monitoring done on these soils has indicated large losses in drainage water under irrigation. These areas would benefit from irrigation systems that can apply low application depths. Large gains in irrigation efficiency are possible in these areas with changed irrigation practices. The wireless MSN would provide invaluable information at these sites about when drainage does and does not occur after a drainage event (See Figure 2).
| a) | 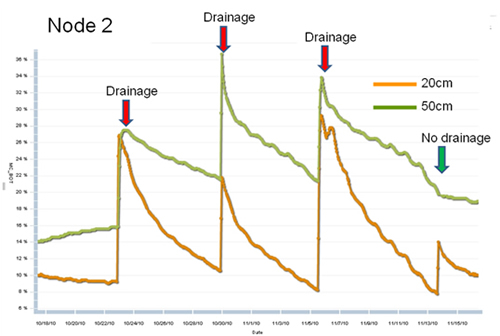 |
| b) | 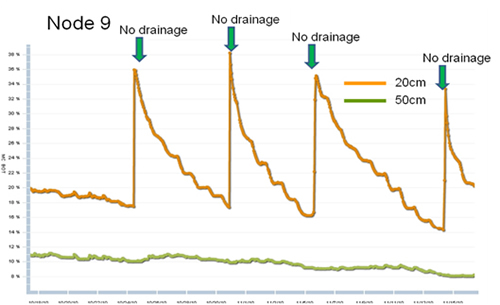 |
| Figure 2: The wireless soil moisture sensor network provides real-time information about when (a) drainage occurs, and (b) drainage does not occur. This information is then used to fine-tune the variable irrigation schedules to different soil zones | |
This work was partly funded by a MAF Sustainable Farming Fund grant: ‘Farm-scale trials of Variable Rate Irrigation’.
Further information:
Carolyn Hedley
New Approach to Māori Involvement in Decision Making
 A new framework for Māori involvement in collaborative science and resource management projects is one of the key developments from the ten-year Integrated Catchment Management research programme on the Motueka River.
The research work with three Motueka iwi: Ngāti Rarua, Te Atiawa, and Ngāti Tama through their resource management agency, Tiakina Te Taiao Ltd, has attracted national attention from government and other Māori groups.
ICM researchers built a collaborative working relationship with these iwi, which led to the adoption of a GIS (geographic information system) and the development of a Māori Cultural Health Index for rivers, adapted from work by Ngai Tahu’s Gail Tipa.
The cultural health of the Motueka and Riwaka Rivers has been monitored by an iwi team and the information compared with research on the state of the rivers using scientific indicators. “This has shown that the two monitoring methods can provide an enriched and complementary understanding of freshwater systems,” says Garth Harmsworth of Landcare Research.
“The two methods can be used side by side by local government, community, iwi and hapū, and research agencies – for example in regional councils’ State-of-the-Environment monitoring of rivers.”
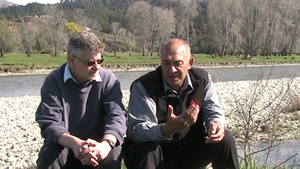
Te Atiawa’s Pat Park says previous generations of local Māori have found it difficult to clearly articulate their concerns about the deterioration of the natural environment. “This programme has given us the scientific bite that adds to what we’ve been saying and now, thankfully, we are starting to be listened to by those in power and they are understanding our worldview, which ultimately is not that dissimilar to theirs.”
Trevor James of Tasman District Council says the process led to better communication about the mutual appreciation of the natural resources. He said that including information about the values that iwi associate with places in the council’s Resource Management Plan would mean Māori issues could be considered up-front in decision making, averting visits to the Environment Court.
The ICM programme has been successful in meeting a range of Māori objectives, such as information collation for iwi management plans, defining the process for undertaking cultural impact assessments of development proposals under the RMA, improved input into resource consent decisions, and contaminated sites management.
The GIS-based information system for knowledge (Matauranga Māori) is now used daily for input into council resource management decision-making.
Importantly Māori also wanted to build the capacity of their people as ‘kaitiaki’ (guardians) of their natural resources. “We (the iwi monitoring team) have different skills and when we apply those skills the others learn. So we learn as much as we give,” says Pat Park. “That’s why we involve other people, so we pass on our knowledge - our kaitiakitanga.”
“Healthy land, healthy people; that’s it in a nutshell,” says monitoring team member, John Katene.
“I can see this working on my Dad’s lands up at Kahungnunu (east coast of the North island), which is where I hope to go and exercise it there,” says another team member, Hori Kahukura. “I know the people there will grab it with both hands.”
Garth Harmsworth says the ICM project has highlighted the importance of the Māori cultural perspective, and its contribution and knowledge for resource management throughout New Zealand.
“In Te Tau Ihu (the top of the south), this can be seen by the development of their overarching iwi pan-tribal resource management committee, enhanced GIS capability at the marae, hapū and iwi level, and the development and incorporation of iwi capacity as shown in environmental monitoring teams.”
Garth has documented the approach used in the ICM programme as guidelines for anyone wanting to consult with iwi. “We’ve developed some effective tools that are relevant right throughout the country.”
Further information:
Garth Harmsworth
Native Forest Management
Thinning ‘therapy’ for beech stands
A Landcare Research-led team has found that the stem diameter of 58-year-old beech trees in a thinned area of forest can be about double the stem diameter of trees in comparable unthinned stands. In addition, differences in timber yield are even wider than the four-fold increase expected from a two-fold increase in stem diameter growth.
The surprising findings came from revisiting two thinning trials that were set up by the former NZ Forest Service in the 1970s.Beech trees grow very slowly in natural forest and even-aged stands regenerating from felled forest tend to develop into dense thickets of saplings and pole-sized trees where competition between trees is strong and individual growth rates slow (in the order of 2 mm in stem diameter per year). Dominant trees are slow to emerge and are expected to lead to rotations of more than 120 years. Beech saplings respond well when competition from neighbours is reduced and exhibit rapid growth rates when grown in isolation. A simple thinning intervention and release from competition will promote tree growth rates and bring a number of associated benefits. Short rotations mean shorter exposure to windthrow, fire or insect attack, and make investments in silvicultural treatments financially more appealing. On top of this, the big logs that result from fast growth imply lower costs of harvesting and processing for well-priced wide boards.
Foresters have long recognized the utility of stand thinning. This led Dudley Franklin of the former NZ Forest Service to establish a number of thinning trials in regenerating beech forest in the early 1970s. Trials were mounted in dense young stands with stockings in the order of 10 000 stems/ha and thickets of up to 50 000 stems/ha. Candidate ‘crop’ trees were tagged and remeasured several times. In collaboration with Larry Burrows and Rob Allen (Landcare Research), David Henley (Scion) and Gordon Baker (private consultant), we have recently remeasured and assessed the response to thinning of silver beech (Nothofagus menziesii) stands to densities ranging between 3000 and 150 stems/ha, and of thinning mixed red (Nothofagus fusca) and hard beech (Nothofagus truncata) stands to densities ranging between 540 and 150 stems/ha. The work was co-funded by MAF Policy and a FRST Program on Sustainable Indigenous Forestry.
The outcomes of intense thinning (stem densities under 550 stems/ha) are remarkable. Mean stem diameter in 58-year old stands with 150 stems/ha is almost double that of unthinned stands (43.2cm compared to 21.1cm for red/hard beech and 35.9 compared to 17.3cm for silver beech). The somewhat faster diameter growth of red/hard beech and their taller stems meant that, at 58 years, merchantable volumes were up to 21 times higher in thinned mixed red/hard beech stands (191 m3/ha) and 7 times higher in thinned silver beech stands (127 m3/ha) when compared with unthinned stands. At 58 years yield tended to maximise at c. 190 stems/ha for red/hard beech stands, whereas it peaked arround 600 stems/ha for the more shade-tolerant silver beech.
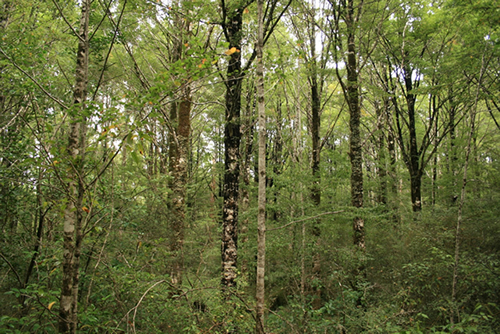 |
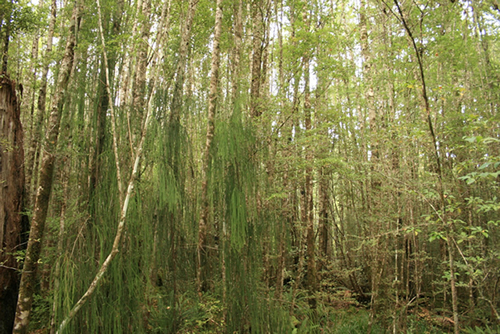 |
| No photographic tricks. Both photos were taken with equal magnification and angle of view (ie focal length) on contiguous even-aged (58-year-old) mixed red and hard beech stands. One of the stands (bottom image) was left unthinned (~ 14 000 stems/ha) whereas the other one was thinned to 250 stems/ha. |
Will such treatments pay off? A first assessment with discounted cashflow analysis for silver beech stands collaboratively undertaken with David Evison, Adam Sewell and Euan Mason at the School of Forestry, University of Canterbury, indicated that thinning operations are currently unprofitable for timber production due to overhead costs and discounting (time value of money). The estimated revenue from trading carbon credits was substantially greater than that of timber production with positive revenue in light thinnings with high biomass accumulation. This economic assessment sets the precedent but will require deeper examination of budgeted costs, associated risks and values gained from managing different beech species for either timber production or carbon farming.
Where to from here? Various other trials were mounted by the former NZ Forest Service between the 1960s and 1980s. These trials constitute an enormous investment and although plot maintenance has mostly been discontinued since the 1990s, we know that some tagged trees can be relocated and valuable information can be obtained from them. We intend to recuperate and remeasure these trials to quantify and demonstrate the gains in tree growth, merchantable timber yield, log quality, and carbon sequestration that can be attained from thinning and pruning a wider range of beech species, over a broader range of ages, and on a more diverse range of sites than previously attempted. We are currently seeking funds to carry on with this work.
Further information:
Tomás Easdale
Weeds & Pests
Weed Identification Key
 Quickly and accurately identifying weeds has become a lot simpler with the launch of a new online weed identification key.
Developed by Landcare Research and other collaborators, the NPPA (National Pest Plant Accord) Key has been designed so that a user does not require extensive plant knowledge to identify weeds. The interactive key covers all 150 pest plant species currently banned from sale, propagation, and distribution within New Zealand, as well as more than 80 non-NPPA weeds and 60 other similar and related species. The key is illustrated with more than 5000 images.
“This new key will significantly benefit those involved in weed control and support their weed management strategies,” says Murray Dawson of Landcare Research, the lead developer.
“Until now, people have used the most authoritative publications – the New Zealand Flora series – to identify plants, but these have complex terminology and descriptions. And often using the traditional printed keys in these Floras you can only identify a plant based on its floral characteristics. This isn’t much help if you’re holding a leafy branch.”
The new key is multi-access, so you can start at any point. Users can identify plants based on 47 characters and 212 character-states, including leaf size and shape, floral and many other characters. Hyperlinks take users to more information at related websites such as MAF Biosecurity New Zealand, Ngā Tipu o Aotearoa – New Zealand Plants databases, and Weedbusters New Zealand.
Murray has run successful workshops to demonstrate the key. “Once you understand the basics, the key is very easy to use. People have been really enthusiastic about it – you can't get them off it!” Between now and March 2011 the key will be expanded to include all 328 species from the Department of Conservation’s (DOC) consolidated environmental weeds list, and it’s likely additional weeds will be added in future.
The development of the key has been funded by DOC’s Terrestrial and Freshwater Biodiversity Information System (TFBIS) Programme.
Further information:
Murray Dawson
Decision Support System for vertebrate pest control
 Recent knowledge about pest management and control has been incorporated into the new DSS.
Vertebrate pest control has become increasingly complex over the last 20 years, prompting Landcare Research to develop a web-based Decision Support System (DSS).
The new tool will improve the transfer of information from researchers to pest managers, to help ensure that the most appropriate control methods are rationally and transparently selected, says one of its designers, Dr Dave Morgan.
Local authorities currently spend about $45 million per year managing vertebrate pest populations, and there are complex considerations.
There is new knowledge of pest impacts and control, an increase in the range of products available for pest control, new legislative requirements for pest control agencies, increased public interest in the impacts and control of pests, diversification of the pest control ‘industry’, and reorganisation of the roles of some of the key participants.
In particular, local authorities have been faced with new responsibilities for pest management on private land under the Resource Management Act and the NZ Biodiversity Strategy. Very broadly, this requires local authorities to identify key biodiversity assets, and sustainably manage them.
As funds are always limited, principally by the number of ratepayers and rate levels, decisions have to be made about which biodiversity assets to manage and how to do this, and this usually involves pest control.
The logic of the new DSS, which is expected to be available by the end of the year, was designed by identifying the ‘generic’ questions that apply when pest managers are considering the most appropriate choice of control method, and using ‘yes/no’ responses to determine the decision paths followed. Such an approach is intuitively easy to understand and unambiguous.
The questions are focussed around the key issues of: operational aims, land tenure, farming practice, public and environmental safety, community views and involvement, and landowner views.
Consideration of these potential constraints in a logical and systematic way results in a series of recommended options being presented that are then further narrowed down by establishing what control methods may have been used previously (as frequent use of many methods results in declining effectiveness), and basing final recommendations on the basis of the likely cost of the remaining suggested methods.
All recommendations will be linked to best-practice advice which is based largely on Department of Conservation documents, and supplemented by practical guidelines for trapping pest animals published by the National Possum Control Agencies (NPCA). Best practice advice is, in most cases well supported by local research findings, for which references are given.
The system emulates the decision-making process that an experienced, well-informed pest manager would typically follow. However, the team stresses that the tool is designed to support, not replace, decision-making by pest managers. This is because there is always the possibility that the DSS may not consider every operational constraint that applies to a particular pest control operation in a particular locality.
While the development was initially driven by the needs of local authorities, the tool will be freely available, and it is likely to find use throughout the pest ‘sector’. It is expected that new information from research, field practice and manufacturers will be incorporated on an ongoing basis.
In summary, the DSS will:
- identify the most appropriate control options in response to proposed operational details and constraints;
- provide transparency/accountability in decision-making by producing a hard copy summary of the DSS input and output;
- enable prioritisation of pest control operations alongside other biodiversity ‘actions’ such as fencing or revegetation;
- provide for a consistent approach nationwide amongst pest managers considering all the key constraints when selecting pest control methods;
- present ‘best current practice’ for all control methods to maximise effectiveness and minimise risks.
This work was funded by an Envirolink ‘Tools’ grant from the Foundation for Research, Science and Technology. The Department of Conservation and NPCA are gratefully acknowledged for generously contributing information to this development.
Further information:
Dave Morgan
Web: Decision Support System (DSS)
Web: Video introduction to DSS
Please note: The newsletters are to keep MAF informed about current research projects. The news items may include interim results that have not been peer reviewed. They should not be disseminated or quoted without first contacting the person mentioned at the end of each item.