Soilscapes for digital soil mapping in New Zealand
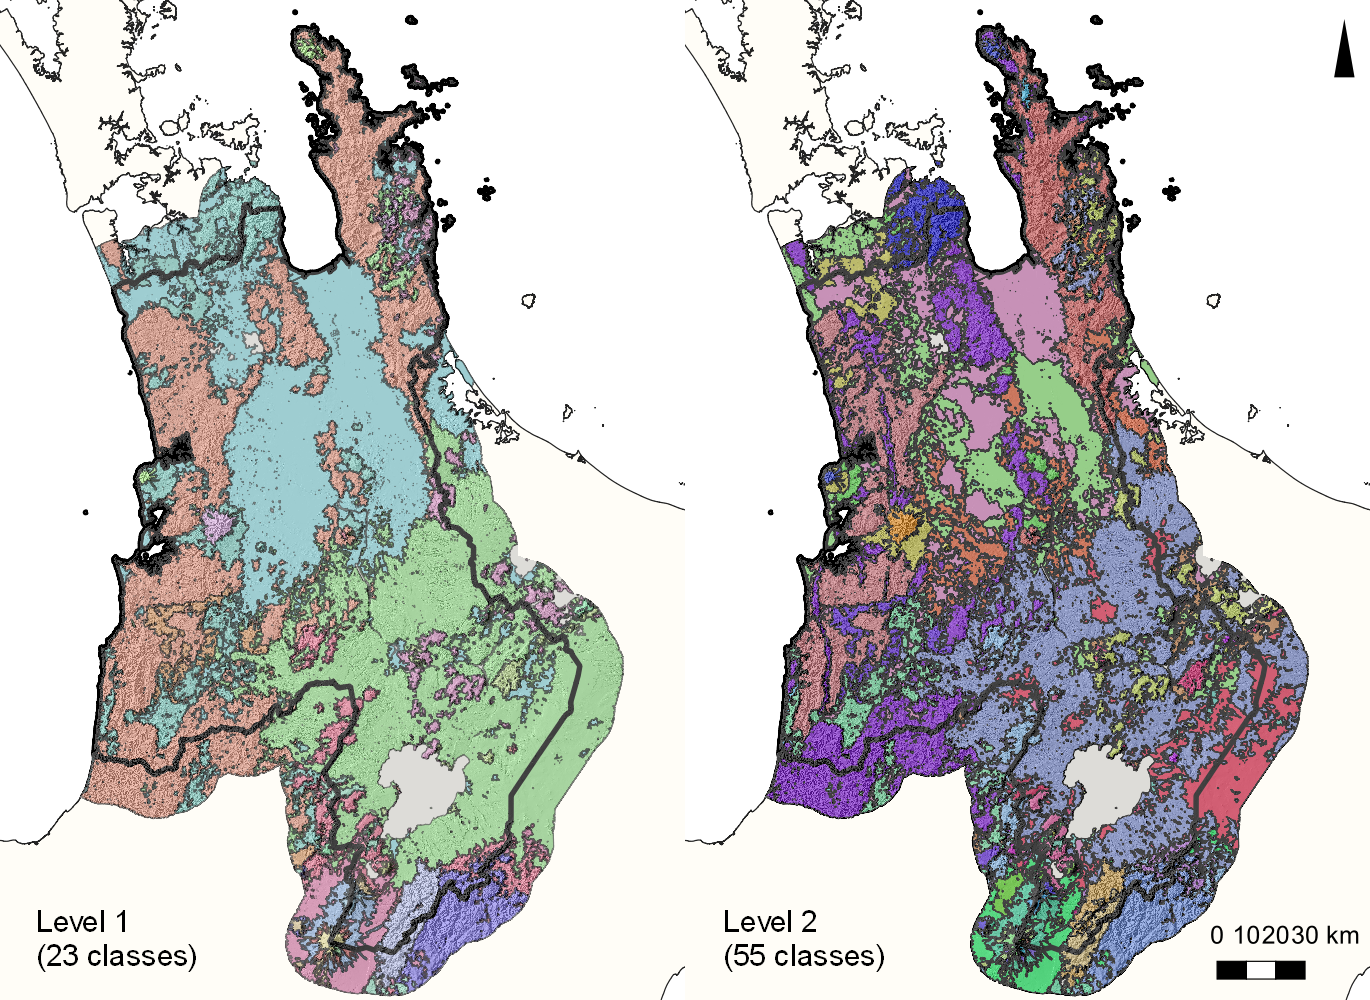
Figure 1: Two levels of proposed soilscapes for the Waikato Region, North Island. Level 2 soilscapes are spatially nested inside Level 1 soilscapes. Coloured zones represent different soilscapes.
Digital soil mapping is a statistical modelling exercise that relates soil classes or properties to data for environmental factors that affect soil formation, such as topography, climate, parent material, etc. The statistical model is a quantitative representation of soil-landscape rules that identify relationships between soil and the environmental factors. They tell us in what parts of the landscape we are likely to find certain soils, or certain properties. For example, in a given hilly landscape, one kind of soil may occur on ridges, another soil may occur on slopes, yet another soil may occur in the valleys.
Let’s consider soil mapping at the national scale. Digital soil mapping can be approached from one of two directions: from the top down, or the bottom up. In the top-down approach, a single soil-landscape model is developed and applied across the entire country to produce a single national soil map. In the bottom-up approach, a patchwork of region-specific models are developed and applied, and the regional soil maps are combined to create a national map. Both approaches have advantages and disadvantages. For example, top-down mapping may be completed relatively rapidly, but constraints such as the quantity and spatial distribution of legacy soil observations, or the size of the budget for collecting new observations, may influence the achievable grid resolution or level of uncertainty in the final map.
Region-specific soil-landscape models may be better adapted to local conditions than a single, national soil-landscape model, but we may sensibly ask where the boundaries between regions should go, and how many regions there should be? A common rule is to subdivide an area of interest into rectangular tiles, or on the basis of administrative boundaries; however, these kinds of subdivisions often ignore natural, pedologically relevant environmental boundaries in the landscape. This means that soil maps produced for adjacent subdivisions may not match smoothly at the edges.
We think that it is wiser to subdivide the landscape into pedologically meaningful regions, since map mismatches at pedologic region boundaries may be acceptable if they are real. The area of applicability of a given statistical soil-landscape model constitutes a pedologically meaningful region, because soil-landscape rules are applied over areas. For example, a set of rules may explain the distribution of a group of soils in an area of low rolling hills, another might apply to soils on alluvial plains, and so on. We call these subdivisions of the landscape soilscapes.
We don’t have soil-landscape rulesets everywhere, so one way to find soilscapes is to try to predict the landscapes that might contain a similar pattern of soils. To do this, we employed a numerical approach called cluster analysis, which we tested in the Waikato Region. First, the landscape was subdivided into small catchment basins, since small catchments are in many ways microcosms of the wider landscape. They have boundaries that are natural and relatively easy to identify. Then we characterised each catchment in terms of environmental spatial data that represent soil forming factors: elevation, slope gradient, average annual rainfall, annual average temperature, and geology. Finally, we clustered the small catchments based on these environmental characteristics, our hypothesis being that catchments that are similar in their environmental characteristics ought to contain a similar range of soils. The area of land occupied by a class of similar catchments may constitute a soilscape.
The approach we took is totally data-driven in the sense that we did not attempt to predefine the number of catchment classes or influence their boundaries in the landscape; we let the cluster analysis discover them based on the relationships between catchments as quantified by their environmental data. Statistical measures commonly used in cluster analysis helped us evaluate the statistically optimal number of catchment classes at several nested levels (Fig. 1). The spatial distribution of the resulting sets of catchment classes showed similarities with other national environmental classifications such as the Land Environments of New Zealand, which gives us confidence in our proposed method.
We are currently evaluating the usefulness of these proposed soilscapes. From an informatics perspective, we want to know if the proposed soilscapes are useful for breaking down big spatial datasets into manageable pieces for digital soil mapping. The delineation of soilscapes is fundamentally a hierarchical problem: which is the right scale at which those soil regions should be separated so that they are useful for further modelling of soil classes and properties nationally?
Finally, from a pedological perspective, we need to understand how the pattern of soils varies between them, and evidence accumulated by testing them in statistical modelling and field work helps us do that.
NATHAN ODGERS, PIERRE ROUDIER – MANAAKI WHENUA