Skip to main content
What is the age of primary decision maker?
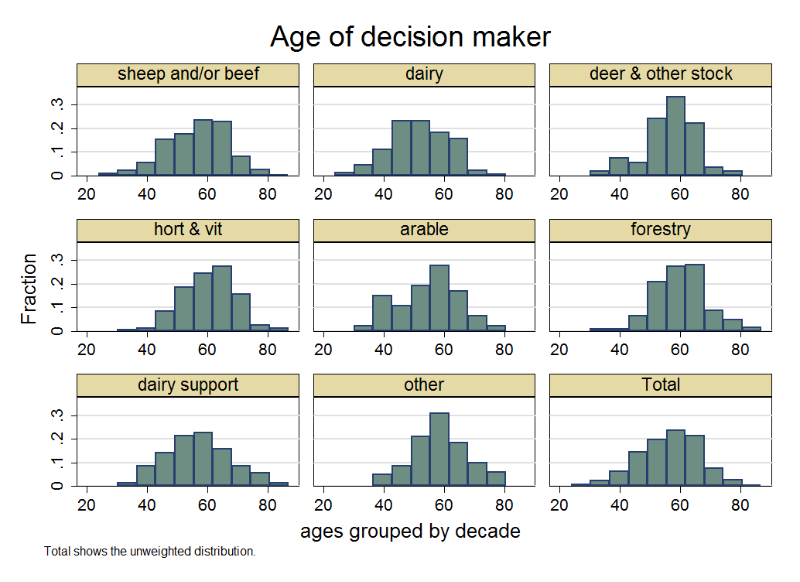
Data by primary land use
| Primary land use |
N |
mean |
sd |
min |
median |
max |
| sheep and/or beef |
694 |
56.65 |
10.25 |
24 |
58 |
86 |
| dairy |
327 |
52.07 |
9.45 |
28 |
52 |
79 |
| deer & other stock |
54 |
56.81 |
8.78 |
31 |
57.5 |
76 |
| hort & vit |
167 |
60.47 |
8.84 |
34 |
61 |
87 |
| arable |
47 |
54.62 |
10.56 |
34 |
56 |
80 |
| forestry |
124 |
60.42 |
8.7 |
31 |
60 |
84 |
| dairy support |
70 |
56.96 |
10.75 |
36 |
56.5 |
83 |
| other |
81 |
58.83 |
8.94 |
40 |
57 |
77 |
| Total |
1,564 |
56.47 |
10.1 |
24 |
57 |
87 |
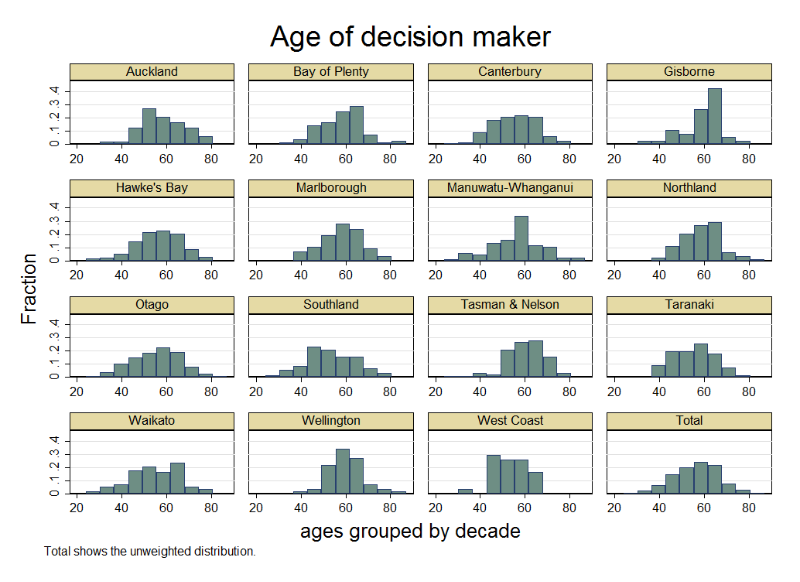
Data by region
| Region |
N |
mean |
sd |
min |
median |
max |
| Auckland |
48 |
58.19 |
10.11 |
33 |
56 |
79 |
| Bay of Plenty |
84 |
58.44 |
9.134 |
36 |
58 |
82 |
| Canterbury |
278 |
55.47 |
9.628 |
25 |
56 |
80 |
| Gisborne |
38 |
59.39 |
8.894 |
36 |
61.5 |
77 |
| Hawke's Bay |
131 |
56.35 |
10.32 |
26 |
57 |
80 |
| Marlborough |
89 |
58.38 |
9.147 |
37 |
59 |
80 |
| Manuwatu-Whanganui |
104 |
56.15 |
11.17 |
30 |
57 |
86 |
| Northland |
83 |
58.96 |
8.741 |
39 |
59 |
83 |
| Otago |
200 |
55.17 |
10.66 |
29 |
56 |
87 |
| Southland |
134 |
53.21 |
10.94 |
28 |
52 |
77 |
| Tasman & Nelson |
105 |
60.41 |
9.277 |
29 |
61 |
79 |
| Taranaki |
67 |
55.6 |
8.993 |
39 |
56 |
75 |
| Waikato |
116 |
54.95 |
10.93 |
24 |
55 |
79 |
| Wellington |
56 |
60.16 |
8.031 |
38 |
59.5 |
84 |
| West Coast |
31 |
53.35 |
7.923 |
36 |
52 |
68 |
| Total |
1,564 |
56.47 |
10.1 |
24 |
57 |
87 |