Skip to main content
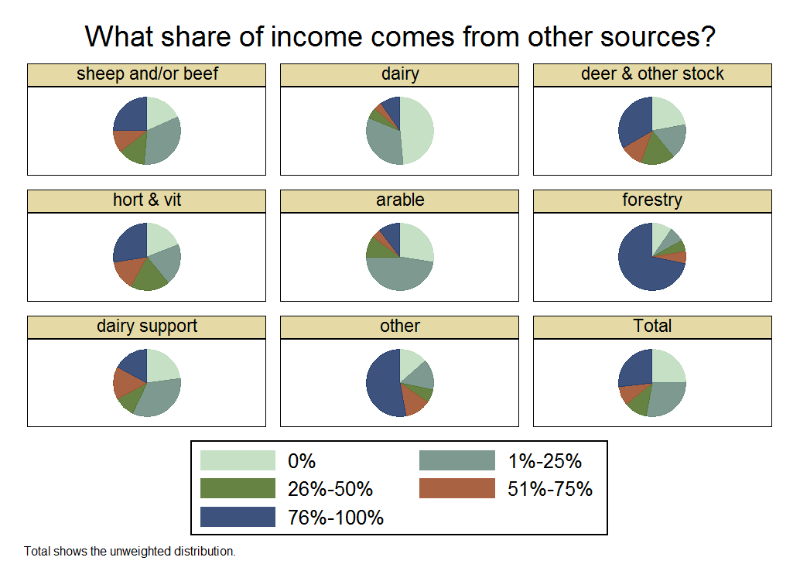
In general, what share of your household’s income comes from sources other than this farm/forest/growing operation?
Data by primary land use
| Primary land use |
0% |
1%-25% |
26%-50% |
51%-75% |
76%-100% |
Total |
| sheep and/or beef |
18.44 |
33.14 |
12.82 |
10.66 |
24.93 |
100 |
| dairy |
48.62 |
32.72 |
5.2 |
3.98 |
9.48 |
100 |
| deer & other stock |
22.22 |
16.67 |
16.67 |
11.11 |
33.33 |
100 |
| hort & vit |
19.16 |
19.76 |
19.16 |
14.37 |
27.54 |
100 |
| arable |
27.66 |
46.81 |
10.64 |
4.26 |
10.64 |
100 |
| forestry |
9.68 |
7.26 |
5.65 |
5.65 |
71.77 |
100 |
| dairy support |
22.86 |
34.29 |
10 |
15.71 |
17.14 |
100 |
| other |
13.58 |
14.81 |
6.17 |
12.35 |
53.09 |
100 |
| Total |
24.49 |
28.52 |
10.93 |
9.4 |
26.66 |
100 |
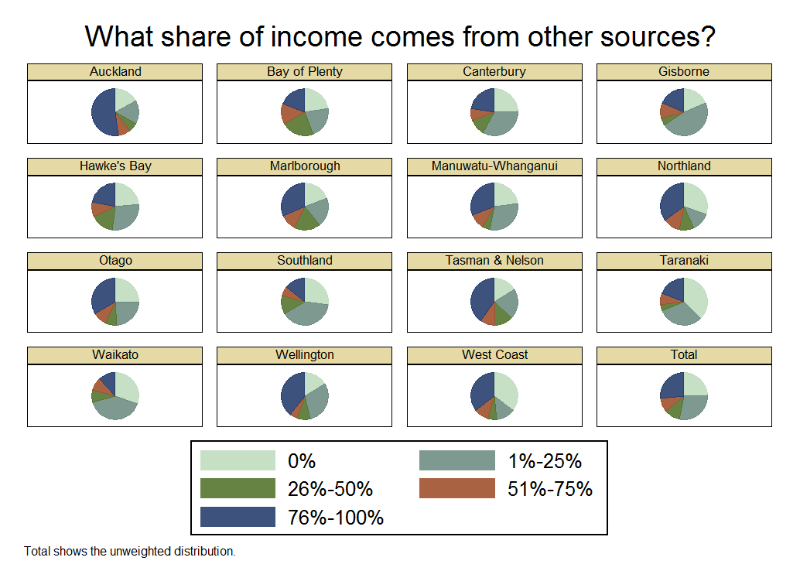
Data by region
| Region |
0% |
1%-25% |
26%-50% |
51%-75% |
76%-100% |
Total |
| Auckland |
16.67 |
16.67 |
6.25 |
8.33 |
52.08 |
100 |
| Bay of Plenty |
22.62 |
21.43 |
22.62 |
14.29 |
19.05 |
100 |
| Canterbury |
24.46 |
33.81 |
10.79 |
8.27 |
22.66 |
100 |
| Gisborne |
18.42 |
47.37 |
5.26 |
10.53 |
18.42 |
100 |
| Hawke's Bay |
23.66 |
28.24 |
16.03 |
9.92 |
22.14 |
100 |
| Marlborough |
19.1 |
20.22 |
17.98 |
11.24 |
31.46 |
100 |
| Manuwatu-Whanganui |
23.08 |
29.81 |
5.77 |
10.58 |
30.77 |
100 |
| Northland |
30.12 |
13.25 |
9.64 |
12.05 |
34.94 |
100 |
| Otago |
25.5 |
23.5 |
8 |
9.5 |
33.5 |
100 |
| Southland |
26.87 |
39.55 |
12.69 |
6.72 |
14.18 |
100 |
| Tasman & Nelson |
16.19 |
20.95 |
12.38 |
10.48 |
40 |
100 |
| Taranaki |
37.31 |
31.34 |
4.48 |
7.46 |
19.4 |
100 |
| Waikato |
30.17 |
40.52 |
8.62 |
8.62 |
12.07 |
100 |
| Wellington |
16.07 |
30.36 |
8.93 |
5.36 |
39.29 |
100 |
| West Coast |
35.48 |
12.9 |
6.45 |
9.68 |
35.48 |
100 |
| Total |
24.49 |
28.52 |
10.93 |
9.4 |
26.66 |
100 |