Issue 2, December 2010
In this issue:
|
|
Editorial
Kia ora tatou
Welcome to Landcare Research’s second research briefing and bumper Xmas issue. Following the sign-off by Cabinet of our Statement of Core Purpose we have been working with our stakeholders on the content and flow of our priority science programmes and their impacts. It was a privilege for us to have Paul Reynolds at a recent workshop with several other key stakeholders in the public and private sectors and our Board. Also, Vera Power attended a workshop with our science team leaders. Both events gave us a better insight into your priorities and how you would like to work with us to make progress towards national goals.
Landcare Research’s purpose is to drive innovation in the management of terrestrial biodiversity and land resources in order to both protect and enhance the terrestrial environment and grow New Zealand’s prosperity. This is clearly aligned with the purpose and goals of MfE. Your priorities around the economy and environment, green growth, new approaches to resource management and governance, the different approaches taken by iwi resource managers, and the demands of evidence-based policy, are all themes that are included in our science priorities. Several of them are reflected in this newsletter.
One important aspect of the CRI reform is to enhance collaboration across the science sector. More clearly defining our scope is a step towards that. For example, in the wording of our Statement of Core Purpose is the notion that Landcare Research comes from a sustainable natural resource perspective and generally a catchment-scale or greater, while primary sector CRIs come from a production perspective at generally a farm-scale. The two approaches are complementary and we have plenty of examples where cross-CRI teams work well across the continuum.
Another important priority is greatly to enhance the accessibility and adoption of knowledge from science and technology programmes. We will be investing in several approaches that increase our engagement with you through the whole lifecycle of science programmes, from foresight of emerging issues to the harvest of value from areas where we have done work for a number of years. We realise that engagement tools are not enough and behaviour change will be needed; and we know that you hae many demands on your time, so efficient approaches are needed.
This need is not new, but the context is now one in which CRIs have more accountability for how we invest our research funding and for the outcomes to which we contribute. Our over-riding concern is for New Zealand to get best value from its investment in science. Landcare Research staff have always been motivated by the purpose of making a difference for the benefit of New Zealand, so I believe we have a good foundation on which to build. We also have a good relationship with MfE that has been enhanced in recent years by challenging projects on which we have worked closely together, complementing each other’s skills. I look forward to more of the same in the years ahead. As Paul Reynolds said to our Board, with society facing big environmental challenges, new conversations and approaches are needed, and Landcare Research is needed for the evidence base that informs both.
I thank you for your support in 2010 and encourage you to keep the pressure on us to make a difference.
I wish you all safe and very enjoyable Christmas holidays.
All the best,
Richard Gordon
General Manager Environment & Society
Land-water environments
Powerful new resource provides online access to important environmental data
 New Zealand has a powerful new online resource to assist people in understanding its diverse natural environments and resources.
With the launch of the Land Resource Information System (LRIS) Portal, individuals working in regional and central government, industry, research and education now have quick and easy access to environment data held by Landcare Research. These geospatial datasets, many of which are considered of national significance, can be used for creating maps, analysis, modelling and generally for finding out about New Zealand’s environments and land resources.
The information available includes records from the New Zealand land resource inventory, data underpinning the land environments NZ (LENZ) data set, fundamental soils layers, regional soil databases and digital elevation models. These data can be used in a diverse range of applications. Examples include catchment and resource management, national monitoring of carbon sources and sinks, studies of climate change, and preparation of farm plans for land managers.
Built using software provided by Koordinates Limited (http://koordinates.com), the LRIS Portal marks a major shift to free on-line access to geospatial information facilitated by Backbone funding from the Foundation for Science Research and Technology.
“Making data collected and managed by Landcare Research available to a wider audience through an easy to use facility is an important first step by Landcare Research to support New Zealand’s government-wide programme to open and reuse government data”, says David Medyckyj-Scott, LRIS Portal Project Leader.
Designed to make the data usable as well as accessible, each data layer comes with metadata (‘data about data’), supporting documents and easy to understand data use licenses. Users can select from a variety of data formats and, using a map-based interface, sub-set the geographic extent of the data so they only download data for the area they are interested. This means users no longer need to store large datasets themselves, they just take the bits they need when they need them.
The amount and type of data available in the portal will be added to significantly in the future.
“We have a list of data we have indentified that can be added to the portal in the coming months” says James Barringer, who manages the data in the portal.
“Many of these datasets haven’t been available publically before but we know they will be of considerable value”.
The portal itself represents the first phase of the development of Landcare Research’s spatial information infrastructure. It is also a key component in creating a new repository of authoritative New Zealand science datasets and information.
Further information:
David Medyckyj-Scott
Environmental markets for New Zealand: barriers & opportunities
Environmental markets could help address environmental issues in New Zealand, according to Research Leader Dr Suzie Greenhalgh and ecologist Dr Susan Walker, although they caution that markets would be more feasible for some commodities than others.
“Greenhouse gases, water quality and water quantity markets are likely to be the most straightforward to establish in New Zealand, but nevertheless face numerous legal, resource and information constraints. Biodiversity is more complex, and the barriers to a successful market are much higher, so we suggest biodiversity markets are probably not feasible at present” says Dr Greenhalgh, the lead author of a report that assesses the issues.
Environmental markets are among an array of intervention options available to policy makers to reduce environmental degradation or improve environmental quality. While markets are not always an appropriate policy response, they are often promoted as a more palatable and cost-effective option for achieving an environmental goal than stand-alone regulation, especially by those regulated. This is because markets can allow greater flexibility to those causing environmental harm in how they meet their regulatory obligations, which may result in cost-savings.
How environmental markets work
With an environmental market a regulated source of environmental harm can comply by making the necessary internal actions to reduce their environmental impact, or they can purchase improvements in environmental quality from other sources that can make these improvements at lower cost.
The development of markets in the last decades has also been encouraged by the need to involve a greater variety of sources of environmental degradation to achieve an environmental goal, especially where it is not politically or economically palatable to apply stand-alone regulation. For example, although agriculture is the largest source of nutrient pollution in many US catchments, there is political reticence to regulate agricultural sources. Establishment of an environmental market for nutrient pollutants can make such regulation more palatable, by allowing agricultural sources to financially benefit from low-cost reductions in their pollution.
Achieving success
The questions many are now asking about environmental markets are whether they are truly successful, and what is needed to establish a successful environmental market.
To answer these questions we must first define success. Dr Greenhalgh and her co-authors define a successful environmental market as one that meets its environmental goal as well as lowers the compliance costs for the regulated participants, provides regulated participants with incentives to innovate and lowers regulator costs (administration, monitoring and enforcement).
To be successful environmental markets require particular conditions and characteristics. These include:
- Precise legislation or rules comprising unambiguous environmental goals and quantitatively defined caps adequate to meet the goal;
- An environmental commodity that can be quantified in an appropriate currency that is "capable of capturing what we care about" as well as a reliable, well-tested measurement and estimation methodology;
- Trading restrictions to prohibit exchanges that would cause negative overall outcomes;
- Sufficient numbers of buyers and sellers (market participants);
- Sufficient technical or management options to reduce environmental damage (e.g., alternative options to reduce emissions, or water use) and/or possible sites to trade;
- Inclusive stakeholder consultation that enables buy-in from the range of interest groups;
- Rigorous and credible enforcement;
- Robust market design with: sound governance, and effective mechanisms for coordination between the different levels of government involved; independent market oversight and review; certainty for participants (e.g., adequate liability arrangements); appropriate capability and resources, and adequate mechanisms for quality control within the administering agency; and appropriate infrastructure to minimise transaction costs.
Barriers in New Zealand
There are a number of barriers to the development of robust and efficient environmental markets in New Zealand. Our primary environmental legislation (the Resource Management Act 1991, or RMA) is enabling in principle, but makes market establishment challenging in practice. A key problem is the ambiguity of ‘sustainable development’, which provides a poor basis for defining environmental goals.
There is also inadequate direction on allocation of property rights and the setting of caps, and limited transferability of consents and permits. Further, the RMA provides no guidance on who has authority to establish and operate markets, and has weak accountability for administrative bodies.
Devolution of most environmental decision-making to regional and district councils under the RMA means varied, and often limited, capacity to assess the need for an environmental market and then to design, establish, operate, monitor and enforce it successfully. Capability problems are compounded by deficiencies in co-operation and co-ordination among central, regional and local government.
Devolution of New Zealand’s environmental governance also increases the likelihood of regulatory capture by local economic interests, and makes it more difficult for dispersed stakeholder interests (like environmental non-government organisations) to engage; a further hindrance to the establishment of successful environmental markets.
The latter point is tied to a second major barrier to successful environmental markets, which is their political viability. Typically, those affected to the underpinning regulation will resist it, affecting subsequent market design, often leading to weak environmental goals and less efficient overall market design.
Cost and lack of environmental data are further hindrances to the establishment of environmental markets in New Zealand, and to subsequent compliance monitoring. Legal constraints on access to private land for inventory and monitoring purposes are likely to be especially problematic for some markets. Finally, New Zealand’s small size may limit potential markets participants (limiting market efficiency) and the number of third party providers for verifying or certifying transaction details and their level of independence (which will compromise quality control).
Overcoming the barriers
To facilitate the development of successful environmental markets for New Zealand, we suggest that various actions are needed to address these barriers. These actions fall into:
- Supporting guidance including:
- Developing guidance to assist government and other relevant stakeholders determine if environmental markets are an appropriate policy response to an environmental problem.
- Developing overarching national market policy and guidance on market design to promote consistency between markets and reduce the cost of establishing markets, and identifying an array of mechanisms that market administrators can legally apply to enforce compliance.
- Amending the RMA to:
-
- clarify the meaning of ‘sustainable development’
- enable councils to formulate precautionary rules and regulations
- overcome limitations on the transferability of consents and permits
- require the Minister for the Environment or territorial authorities/regional councils to specify measurable environmental goals or promulgate new legislation for market operation
- create better means for revoking permits for lack of compliance
- Establishing an independent oversight committee or ombudsman to act as grievance body for public oversight concerns with markets, and requiring market administrators to submit annual reports on market performance to that body.
- Requiring that environmental markets be subject to regular independent audits.
- Legislative amendments including:
- Developing market infrastructure, such as a national marketplace and registry for all environmental markets.
"In summary, environmental markets are not suitable for all commodities and all situations, and require particular conditions to work well. In New Zealand, markets could be successful for some commodities and in some regions, but our environmental law, administration and data arrangements don’t make their establishment easy. Our report looks at the barriers and the work needed to do to create the right conditions," says Dr Walker.
Further information:
Suzie Greenhalgh
Susan Walker
New Approach to Māori Involvement in Decision Making
 A new framework for Māori involvement in collaborative science and resource management projects is one of the key developments from the ten-year Integrated Catchment Management research programme on the Motueka River.
The research work with three Motueka iwi: Ngāti Rarua, Te Atiawa, and Ngāti Tama through their resource management agency, Tiakina Te Taiao Ltd, has attracted national attention from government and other Māori groups.
ICM researchers built a collaborative working relationship with these iwi, which led to the adoption of a GIS (geographic information system) and the development of a Māori Cultural Health Index for rivers, adapted from work by Ngai Tahu’s Gail Tipa.
The cultural health of the Motueka and Riwaka Rivers has been monitored by an iwi team and the information compared with research on the state of the rivers using scientific indicators. “This has shown that the two monitoring methods can provide an enriched and complementary understanding of freshwater systems,” says Garth Harmsworth of Landcare Research.
“The two methods can be used side by side by local government, community, iwi and hapū, and research agencies – for example in regional councils’ State-of-the-Environment monitoring of rivers.”
Te Atiawa’s Pat Park says previous generations of local Māori have found it difficult to clearly articulate their concerns about the deterioration of the natural environment. “This programme has given us the scientific bite that adds to what we’ve been saying and now, thankfully, we are starting to be listened to by those in power and they are understanding our worldview, which ultimately is not that dissimilar to theirs.”
Trevor James of Tasman District Council says the process led to better communication about the mutual appreciation of the natural resources. He said that including information about the values that iwi associate with places in the council’s Resource Management Plan would mean Māori issues could be considered up-front in decision making, averting visits to the Environment Court.
The ICM programme has been successful in meeting a range of Māori objectives, such as information collation for iwi management plans, defining the process for undertaking cultural impact assessments of development proposals under the RMA, improved input into resource consent decisions, and contaminated sites management.
The GIS-based information system for knowledge (Matauranga Māori) is now used daily for input into council resource management decision-making.
Importantly Māori also wanted to build the capacity of their people as ‘kaitiaki’ (guardians) of their natural resources. “We (the iwi monitoring team) have different skills and when we apply those skills the others learn. So we learn as much as we give,” says Pat Park. “That’s why we involve other people, so we pass on our knowledge - our kaitiakitanga.”
“Healthy land, healthy people; that’s it in a nutshell,” says monitoring team member, John Katene.
“I can see this working on my Dad’s lands up at Kahungnunu (east coast of the North island), which is where I hope to go and exercise it there,” says another team member, Hori Kahukura. “I know the people there will grab it with both hands.”
Garth Harmsworth says the ICM project has highlighted the importance of the Māori cultural perspective, and its contribution and knowledge for resource management throughout New Zealand.
“In Te Tau Ihu (the top of the south), this can be seen by the development of their overarching iwi pan-tribal resource management committee, enhanced GIS capability at the marae, hapū and iwi level, and the development and incorporation of iwi capacity as shown in environmental monitoring teams.”
Garth has documented the approach used in the ICM programme as guidelines for anyone wanting to consult with iwi. “We’ve developed some effective tools that are relevant right throughout the country.”
Further information:
Garth Harmsworth
New tools for improving irrigation efficiency
 Efficient use of the soil water resource has considerable potential for improving irrigation systems.
Assuming average soil water storage capacity of 100mm, at any one time the 750,000 ha of irrigated New Zealand land could be storing about 750M m3 of water. Landcare Research’s mapping of soil variability indicates the soil water resource could vary by ±20% (i.e. ±150M m3), making accurate characterisation of the soil water resource a keystone to efficient irrigation.
Accurate soil mapping and the development of other innovative new soil-based tools for improving irrigation efficiency was discussed at a recent Landcare Research workshop.
Ensuring irrigation is optimised to the needs of the crop and the water holding capacity of the soil improves crop production, makes best use of available water, saves electricity and minimises nutrient leaching into ground water.
Interest in efficient irrigation is increasing as demand for freshwater heightens. Landcare Research soil scientist Sam Carrick says the increasing demand for water can be met only two ways: by increasing water storage options – with obvious social and environmental challenges – and through improving our irrigation systems.
Attended by representatives of MAF, MfE, regional councils, industry groups and CRIs, the irrigation efficiency workshop covered improvements in landscape to farm scale tools, such as Landcare Research’s Soil Mapping Portal, as well as paddock scale tools such as electro-magnetic mapping of the variability of soil water holding capacity, precision irrigation technology, and the real time monitoring of soil moisture levels.
Landscape scale tools
Efficient irrigation is dependent on the availability of comprehensive, accurate soil-water information. Landcare Research’s focus has been to make existing landscape scale information easier to access and to develop new information where it is needed.
“We have partnered with the Southland, Otago and Canterbury Regional Councils to make digital soil information online, which has proved popular,” says Dr Carrick, “and we have been working with end users and are now developing an intuitive Soil Mapping Portal that will combine a wide range of soil data with flexible and dynamic information products.”
Demonstrated at the workshop, the new portal infrastructure will largely be operational by the middle of next year, but the completion of all the underlying soil map data is reliant on future funding.
Portal visitors will use an interactive map to click on the soil type in their area of interest. This will take them to a web page for that soil type that includes practical information such as irrigation advice, and agricultural and environmental management information, as well as a soil profile description and other technical information.
We are also continuing to expand S-map, our national soil map database. We have been working to move from regional to farm scale soil maps, and create related information sheets.
We have high quality data on most South Island soils but with the exception of the Bay of Plenty, there is a lot more work to do defining North Island soils. This work involves both converting historical paper maps to digital format, as well as filling in knowledge gaps. In 2011 Wellington Regional Council is funding such a gap-filling project, the mapping of Wairarapa Plains, an area of interest for future irrigation development.
Paddock scale tools
In areas with low soil variability, S-map, with its farm scale data, will provide the necessary soil information. But there are large areas of land with high soil variability where paddock scale mapping may be required to ensure efficient irrigation. On some farms, light soils in one area have less than half the water holding capacity of heavier soils a short distance away.
 |
 |
| On some farms heavy soils (left) have more than twice the water holding capacity of light soils (right). | |
S-map has the capability to identify the areas of variable soils, and link to relevant information or case studies on options for paddock scale mapping.
A key tool developed through ongoing research by Dr Carolyn Hedley is an electromagnetic sensor, towed behind a GPS-equipped quad bike that enables the creation of an available water holding capacity (AWC) map for the irrigated land. The data is programmed into a variable rate irrigator (as outlined in the first edition of MAF Update) to apply the appropriate amount of water for the crop type and water holding capacity of the soil that the irrigator is passing over. Water savings of 9-21% have been achieved at five trial sites around the country, achieving cost savings of $61-150 per hectare year (based on an estimated cost of $2 per mm/ha).
We are also taking the guesswork out of estimating soil moisture by developing wireless soil moisture sensor networks. The networks enable irrigation scheduling using real time soil water storage measurements in each zone of different water holding capacity by feeding the information back to the variable rate irrigator.
“If farmers are over-irrigating by just .5mm per day across the entire area of currently irrigated land in New Zealand then we are wasting 150M cubic metres of water per year. We can stop trying to estimate the impossible and accurately measure soil water storage in real time.
“In summary we have the technology to improve current irrigation practices. Irrigation based on real time soil water storage data enables us to save water and allow new water allocation, increase profitability and reduce drainage and ground water pollution.”
Measuring drainage
An innovative new lysimeter for measuring drainage from soils was also explained at the seminar.
“There is a real need for a low-cost, low-maintenance tool farmers can use to measure drainage,” says Dr Carrick. “We are developing a new design that is accurate, inexpensive, and simple to install and maintain. It is valid for different land uses and soils, and enables real time monitoring of irrigation and nitrate leaching.”
Further information:
Sam Carrick
Carolyn Hedley
Mapping irrigated land
How much irrigable land is there in New Zealand? Where is the growth occurring? Where will we need additional water storage?
Landcare Research has provided some answers to these important questions for central and regional government by mapping New Zealand’s irrigable land.
There is about 600,000ha of irrigable land in New Zealand, a figure that has increased rapidly in recent years. The area of land that can be irrigated is now reaching near total allocation, raising significant issue for decision makers.
The pressure on water use also means that tools for improving efficiency of use are needed. A map of irrigated land combined with a soil map will help optimise water use.
However, although farmers are well aware of where the irrigated land is, mapping at regional or national scale is not trivial. Regional councils hold information on the consented areas for extracting water from rivers or groundwater, but that doesn’t say how much of this water is actually used in any one year. In addition, water could be extracted in areas away from consented locations.
Landcare Research estimated the area of irrigable land by overlaying information on farm boundaries and resource consent locations. This exercise was done in five regions (Manawatu, Hawkes Bay, Wellington, Otago and Canterbury). But, this only estimates the potential for irrigation, not active irrigation. Satellite images can be used to detect greenness of the land and pivot irrigators. This information shows where irrigation actually occurs.
We tested this approach in two regions, Manawatu-Wanganui and Hawkes Bay, and used mosaics of Landsat ETM+ images acquired in 2001 and SPOT 5 images acquired in summer 2008. By overlaying the farms with freshwater resource consents for irrigation, we were visually interpreting the landscape to determine if the land was irrigated or not.
This preliminary study showed that the accuracy of the mapping relies heavily on the acquisition dates of the images. As shown on figure 1, the irrigated land was interpretable where the land was dry enough to distinguish greenness due to irrigation from greenness due to naturally lush pastures.
 |
| Figure 1. An example of irrigated land (red line) mapped on a mosaic of SPOT images in false colours. Cyan colour represents bare ground (dry or ploughed fields, cities, roads), shades of orange represents levels of green pasture. The upper part of the mosaic was taken from imagery during a dry period. |
In the future, Landcare Research envisages developing a two-level approach:
- At the national scale, we can produce a map using a national database of resource consents compiled by MfE and farm boundaries. We can improve on the methodology by using simple rules to calculate the effective irrigated area in each property based on consented volume per day, and by removing obvious non-irrigated areas (e.g. uplands).
- At the regional scale, we can use satellite images to visually interpret irrigated land. We can identify the appropriate high resolution satellite imagery by assessing driest period using NIWA soil moisture deficit archives. Using any other ancillary information (aerial photos, GoogleEarth, regional council information), we can build on our previous experience to produce a 1:50,000 scale map of current irrigation.
Further information:
Carolyn Hedley
Anne-Gaelle Ausseil
Governance for success in irrigation development
 A recent announcement of $739,000 of Government funding for irrigation projects, including a ‘how to guide’ for the development of water user groups, has again placed the public spotlight on water resources and water allocation.
As proposals develop with Government support, Landcare Research researchers have been investigating the key social factors for getting new irrigation schemes underway and the important ingredients for effective governance.
Earlier this year the researchers interviewed people connected with five irrigation organisations in Canterbury and Otago; the Kakanui Water Allocation Committee, the Maniototo Irrigation Company, the Te Ngawai Water Users Group, the Opuha Water Partnership, and the Ashburton–Lyndhurst Irrigation Company. These groups were selected to reflect a range of ages, sizes, histories and origins.
Researchers interviewed farmer leaders in each group as well as liaison and regulatory staff in the Otago and Canterbury regional councils, and staff and office holders of third-party organisations that were required by consent condition or other legal arrangement to work with the irrigation organisations.
From these interviews a set of ‘factors’ emerged that are needed for the effective operation of these voluntary water sharing or communal irrigation schemes. These conditions seem to us to be important ingredients for the further development and effective operation of the self-management model in both regions.
The factors are:
- Community-based leadership
- Local identity
- Shared knowledge
- Reliable and up-to-date information
- Good relationships with regulators
1. Community-based leadership
Wisdom and judgement are essential in governance together with an ability to ‘take people along’ in a constructive and cooperative process. In all the cases studied, one individual or a small group of people have ‘put their hand up’ to take a decision or to guide or lead a group to a decision. Support is also needed from central or local government. The leader adds credibility to the group and this helps with engagement with the community and regulator.
2. Local identity
Where landowners/irrigators have a strong sense of place and identify with an area, its history and its land and rivers, governance arrangements and management decisions relating to that place and those resources are more likely to reflect the long-term needs of the community. Other users of the area, principally of the rivers, may also identify strongly with the area, laying the foundation for partnership around common goals. The arrival of new owners without local history and with different farming experience can threaten or destabilise both internal and external relationships, at least in the short term.
3. Shared knowledge
Stakeholders must have a good understanding of each others’ issues and concerns. This involves a shared knowledge of the different factors that bear upon a scheme such as land use (and misuse), water quality, ecology, and recreation. This aspect is the most visible and was common to the case studies, and includes recognition of the values of the local iwi.
Sharing of experiences is also an important trust-building factor and is time dependent. Eighteen months is reported in three case studies as the time span for meetings, information sharing and discussion to deliver marked benefits in compromise and concession between different interest groups.
4. Reliable and up-to-date information
Irrigators, regulators and stakeholders recognise the need for accurate information on water application and current and forecast water availability. Improving standards of measuring monitoring and reporting by all parties involved in water management and water use will lead to increased confidence in the data, and science, used to inform decision-making around water allocation and environmental flows.
5. Good relationships with regulators
A key challenge is establishing and maintaining empathy and trust between the individualistic and self-reliant farmers and the rule and regulation-focused regional council. The involvement of regional council field officers constructively bridges these divides.
Trust relationships are central to the effective operation of communal irrigation schemes. This was highlighted in many of the interviews and was a central theme regarding relationships between irrigation scheme members and their leaders, with external stakeholders, and with regulators.
Increased trust between those involved directly in irrigation schemes, and regulators and stakeholders, is increasingly recognised to shorten the consenting process and reduce the risk of litigation.
Further information:
Shona Russell
Nitrate leaching model for quantifying ecosystem services
 Two Landcare Research scientists have developed a spatial model for predicting nitrate leaching anywhere in New Zealand.
Nitrate leaching into surface and ground water is a major issue for New Zealand’s pastoral agriculture industry. Fertiliser use and animal excreta can increase nitrogen in waterways, promoting the growth of periphyton (algae, microbes, detritus) and degrading aquatic habitat and recreational values.
The model, developed by John Dymond and Anne-Gaelle Ausseil as part of the FRST-funded Ecosystem Services for Multiple Outcomes Programme, takes into account land use, stock numbers, soil type, and climate.
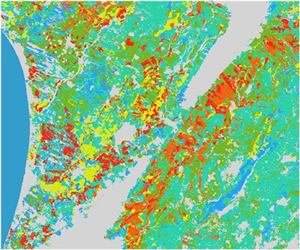
The spatial model produces an output map of nitrate leaching (kg N ha-1 yr-1) from input maps of land use and animal numbers (Figure 1). The model was developed by running Overseer® (an agricultural management tool that assists in examining nutrient use and movements within a farm) for every possible soil and climate combination in New Zealand. As such, the results of this model should be identical to Overseer® for specific farm paddocks where the stocking rates are the same. However, this model can be run spatially over large areas, without needing to know the soils or climate, because they are embedded implicitly in the model.
The results are expressed as leaching rates per stock unit and stored in tables associated with national soil maps (Figure 2). The nitrate leaching rates per stock unit can then be combined with a map of animal numbers (produced by the FRST-funded Greenhouse Gas Programme) to produce a map of nitrate leaching at the national scale.
The leaching rates per stock unit shown in Figure 2 are clearly driven by both rainfall and soil type. When annual rainfall is 500mm the leaching rate is approximately 0.5 kg N ha-1 yr-1 su-1. When annual rainfall is 2000 mm, the leaching rate is approximately three times that at 1.5 kg N ha-1 yr-1 su-1. The spatial variation in leaching rate needs to be taken into account when planning land use. Certainly on shallow soils with high rainfall, leaching rates will be excessively high and will necessitate special mitigation measures.
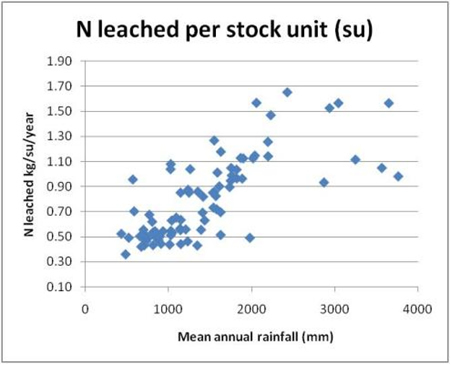 |
| Figure 2. Plot of nitrogen leaching rate per stock unit as a function of mean annual rainfall. Each point represents a unique soil-climate type in New Zealand. |
This model will be used with other models to characterise the relationships between land use/management and a full range of provisioning, regulating, cultural, and supporting ecosystem services.
Further information:
John Dymond
Anne-Gaelle Ausseil
Climate change responses
Soil carbon research heats up
 Globally, soil respiration releases ten times more carbon dioxide into the atmosphere than the burning of fossil fuels. So small changes in the amount of carbon lost from soil organic matter with a warming climate could have major effects on climate change.
To get a better understanding of the effect of soil warming, a team of Landcare Research, University of Canterbury and Macaulay Land Use Research Institute (Scotland) scientists are using state-of-the-art equipment to simulate and measure the effects of increased soil warming on carbon dioxide release from soils in tussock grassland in the Canterbury high country.
Electrical cables buried in replicated plots are heating the soil 3 degrees centigrade above the temperature in the control plots. Scientists are using a tuneable diode laser to measure sources of carbon dioxide released from the soil by analysing subtle changes in the isotopic composition. This world leading technique was perfected by Landcare Research and collaborating scientists at Lincoln.
This research is expected to provide new insights that will improve models of global carbon cycling and climate change, according to Landcare Research Global Change Processes Team Leader, Dr David Whitehead.
“When most people think of the carbon stored in a terrestrial ecosystem they think of the above-ground biomass – the trunks, branches and leaves of trees and shrubs,” says David. “But soil has by far the largest pool of terrestrial carbon. Soil respiration – carbon dioxide released by everything living in the soil – has a major impact on atmospheric carbon dioxide concentration.
“Hence small shifts in the amount of carbon lost from soil organic matter as a consequence of a warming climate could have major feedback effects on climate change. With much of New Zealand’s surface area covered in tussock grassland, the research in this location is particularly relevant.
The research is funded by the Foundation for Research, Science and Technology.
Further information:
David Whitehead
Indigenous forest carbon sequestration – answering the big questions
 How much carbon is stored in our native vegetation? How quickly is it currently accumulating? How is that likely to change in future? And how could indigenous forests be managed to optimise carbon sequestration?
Recently MAF International Policy contracted Landcare Research to provide answers to these questions, to help New Zealand meet its climate change responsibilities.
Landcare Research scientist Dr Robert Holdaway, who is leading the work, says detailed empirical data and supporting modelling exist for exotic production forests but the information for indigenous forests is much less clear.
To quantify and evaluate the actual carbon stocks by current native vegetation type and by region, Robert and his colleagues are using LUCAS (the Land Use and Carbon Analysis System) data from the National Vegetation Survey (NVS) database.
 LUCAS has a total of 1372 permanent carbon monitoring plots based on an 8 km grid across the New Zealand landscape, with plots located on all grid intersections with land-use classified as indigenous forest or shrubland according to the New Zealand Land Cover Database 1 (LCDB1). The entire plot network was measured between 2002 and 2007.
Calculations of stored carbon will take into account carbon in live biomass of tree stems, branches, roots, standing dead stems, coarse wood debris and shrubs.
Earlier research has shown that anthropogenic or human-induced disturbance (e.g., logging, clearing, and burning) has produced a significant shift in the composition and age-structure of many New Zealand forests towards young or regenerating forest types. Such forests are likely to have less carbon (on average) than forests affected by purely natural disturbance (e.g., storms, earthquakes). While the natural disturbance is unavoidable, proper forest management could remove the effect of human disturbance.
A mix of plot measurements and satellite data are being used to directly quantify the effect of human disturbance on total carbon content. Plot-based variables include the presence/absence of grazing (managed stock only), clearing, mining, fire, logging, and the presence of tracks. The satellite data will be used to assess the level of “naturalness” of the vegetation cover at each location. The two complementary approaches will then be used to model potential carbon stocks in the absence of all such disturbances.
There is little explicit information about the consequences of management in terms of carbon sequestration rates so work in this area will still be somewhat speculative as the researchers focus on determining the scale at which optimal management could maximize gains or minimize losses in C sequestration (beyond current management) over the next couple of decades.
The team is modelling changes in carbon stock between 2010 and 2022 for each LUCAS plot assuming no dispersal or human-induced limitation on seedling establishment, i.e. species are free to establish whenever the local conditions are suitable. Rates of sequestration derived from these models represent a conservative upper limit of what is achievable through optimal management. Conservative criteria are then being used to assess likelihood of regeneration under current management. These include the presence of tree species capable of growing >5m tall with a combined cover score of >5%, absence of managed grazing, absence of historical ‘fire’ and ‘clearing’, and the current land-use excludes fire and clearing as common practice. Land tenure information (DOC/private ownership) was used to assess this last factor, since clearing and burning are not common management activities on conservation land, whereas they are a common part of agricultural management.
Plots not currently regenerating were assessed in terms of the scale of management changes required to achieve optimal sequestration rates. ‘Optimum’ management activities can be grouped into three categories based on the intensity of human intervention required:
- land-use change with no direct intervention
- adoption of basic permanent forest management practices
- fencing and removal of stock
- halting all periodic burning / clearing
- minor pest and weed control where appropriate
- periodic or low intensity intervention
- collecting and spreading seed to aid establishment of key species (e.g., kanuka, beech)
- intensive grazing prior to heavy seeding to encourage tree seedling establishment
- creating small scale regeneration gaps (e.g., through spot spraying or scarification to remove grass sward)
- intensive human intervention
- extensive seeding and planting of key tree species
- Continuous management (e.g. watering, intensive weed and animal pest control) to ensure successful establishment.
Key results will include national-level predictions of short-term sequestration rates in existing indigenous forest and shrubland under both current and optimal management.
The research will better enable officials to make an informed decision about ‘business as usual’ sequestration in indigenous forests, what actions are needed to increase the sequestration to optimal levels, and what the risks of reversals are.
Further information:
Robert Holdaway
Steven Cox, MAF
Soil carbon loss under dairy farms
The amount of soil carbon lost under dairy farms appears to have slowed in the last five years, according to soil scientists from Landcare Research, GNS and University of Waikato, who have been studying changes in soil organic matter under pasture. Dr Roger Parfitt explains.
We have measured soil carbon (C), as an assessment of soil organic matter, under pasture on three occasions over the last 27 years at dairy farms and sheep/beef farms. We previously reported the changes in soil C between 1982 and 2004 for 30 sites where we found that it was decreasing by 0.8 tonnes C/ha/year for the whole soil profile.
International reporting (IPCC) requires that we report for a soil depth of 0-30cm.
We now have data for 83 sites, and we found that for sheep and beef farms there was no measurable loss of soil C over the last 22 years (Figure 1); the average total soil C in 1982 was 132 T/ha and for 2004 was 128 T/ha (this small change was not statistically different). But for dairy farming there was a significant loss of 0.7 T C/ha/year for 29 dairy sites.
When we separated the non-Allophanic soils from the Allophanic soils (Taranaki and Waikato) the average losses were similar although the non-Allophanic soils contain less total C (122 T/ha to 105 T/ha) compared with Allophanic soils (194 T/ha to 176 T/ha) (Figure 1).
 |
| Figure 1. Soil carbon at sheep/beef farms, and dairy farms on Non-Allophanic Soils (NonA) and Allophanic soils in Taranaki and Waikato (A) for 0-30 cm depth for 83 sites. Error bars are standard error of the mean. The years actually have a range and the Figure is illustrative. |
We also have preliminary soil C data for 2009 from 22 farms (Figure 2). They indicate no further measurable loss of C between 2004 and 2009; however, insufficient time has passed to be able to detect ongoing change in soil C stocks, because of the considerable variability in soil C within a paddock. We are investigating how many sites need to be measured, over how many years, in order to get a robust measure of change in soil C.
 |
| Figure 2. Soil carbon at sheep/beef farms, and dairy farms on Non-Allophanic Soils (NonA) and Allophanic soils in Taranaki and Waikato (A) for 0-30 cm depth for 22 sites. Error bars are standard error of the mean. |
The possible reasons for the loss of soil C under dairying also are being investigated. The use of N fertiliser increased from 1990 to 2004 (Figure 3) mainly on dairy farms, and over this time pasture has been farmed more intensively. For dairy pastures, the soil C:N ratio appeared to decrease from 11.4 to 11.1 suggesting that soil N fertility was increasing.
 |
| Figure 3. N Fertiliser consumed in NZ (H. Furness). |
With increased N input, there may be less C input from roots to soil, and there will be greater additions of cow urine-N to the soil. Preliminary work suggests that cow urine can accelerate decomposition of soil organic matter. Therefore the intensive use of pasture under dairying may contribute to the loss of C.
Since 2004 the use of N fertiliser has not increased but it is probably too early to say whether soil C has arrived at a new level.
Further information:
Roger Parfitt
Sustainable business and communities
How do stony soils cope with dairy shed effluent?
 Landcare Research is studying the ability of stony soils, such as those found in the Mackenzie Basin, to handle dairy shed effluent.
Over the last 15 years Landcare Research has developed a good understanding of how different soils treat microbes in dairy shed effluent that is applied to the soil’s surface.
Central to this research is the use of lysimeters - undisturbed soil cores in purpose-built barrels. Dairy shed effluent and artificial rainfall is irrigated onto the soil core, and the leachate is analysed for microbial indicators.
Not surprisingly, the microbial load in dairy shed effluent is very high. Soil Scientist Malcolm McLeod has found that the leachate from some soils contained microbial loads nearly as great as in the irrigated dairy shed effluent. On the other hand, microbes were not detected in the leachate from some other New Zealand soils. This suggests some soils play a significant role in moderating the microbial load that can potentially reach shallow groundwater or surface water, while others have little effect.
A nice friable soil will retain microbes but a clayey soil with many cracks will allow microbes to leach quickly through the soil.
Landcare Research soil scientists have produced a general map for all of New Zealand showing if and where soils are “leaky” to microbes or retained within the soil. The longer that microbes can be retained in the soil the better the chance for them to die-off by desiccation or be eaten by other ‘mini animals' in the soil.
The map also revealed a general lack of knowledge about stony soils. To remedy this, Malcolm and other Hamilton-based colleagues went to Pukaki Airport in the heart of the Mackenzie Basin to collect cores from a series of sites that had stones at the surface, stones starting at 30 cm depth and stones starting at 50 cm depth. Four replicate undisturbed cores, 50cms in diameter and 70cms high, from each soil type were collected. These oil cores have now been transported to the laboratory in Hamilton in preparation for being irrigated with dairy shed effluent.
Malcolm says that with the spread of dairying to areas with poorer quality soils, such as the Mackenzie Basin, there is keen interest in the results of the research.
This work was funded by a FRST Sustaining Soil Services contract.
Further information:
Malcolm McLeod
Life cycle management: the full picture
Several innovative New Zealand companies are putting the learnings from a Landcare Research-led programme on Life Cycle Management to good effect, as this article in a recent edition of Unlimited magazine explains.
Further information:
Anthony Hume
Biodiversity
Considering Ecosystem Services in Policy & Planning
 Ecosystems are the result of a complex interplay among climate, water, soils, and species, including humans. Ecosystems perform the functions needed to support life on Earth, such as regulating climate, cycling nutrients, or purifying water.
Ecosystem services are defined as the direct benefits that humans derive from ecosystems. For example, fungi, worms, and bacteria process materials to create the fertile soils necessary to grow our food. The transformation of those materials is one service provided by ecosystems.
Taken together, the minerals, nutrients, organisms and their interactions represent “natural capital,” which is a natural analogue of the built capital such as our industries and factories that produce goods and services that we desire. Just like our built capital, we need to maintain and enhance our natural capital to insure an on-going flow of services that we need to maintain our quality of life.
More detailed studies of ecosystem services have only recently started. Landcare Research is undertaking an innovative new project to address the wise use of land and natural resources in New Zealand by considering all services provided by ecosystems in natural resource planning, policy and decision-making.
Currently, there are many regulations governing the use of natural resources including resource consents, regional/district plans, and national policies, says Dr John Dymond.
“They are all made at a variety of scales, administered by multiple agents, and often focus on a single issue or an ecosystem service. Furthermore, the information on which these decisions are made is sparse. This fragmented approach threatens New Zealand’s environmental integrity and trade.
“Our research will provide the data, knowledge, tools, and unifying concept to underpin a shift in natural resource management to move away from basing decisions entirely on maximising ‘provisioning’ ecosystem services, such as food and fibre, to consideration of a broader range of services critical to NZ’s overall well-being.
“Our team will produce a nationwide assessment of ecosystem services, determine how ecosystem services are linked to land use and management and offer a framework to adapt natural resource planning and policy across a broad range of outcomes.”
Dr Dymond says the work will be done in several ways including adapting respected international frameworks to local conditions and undertaking the first national scale attempt to comprehensively characterise current and future ecosystem services in New Zealand.
“We’re transforming a research concept into a policy instrument by assessing what types of information, data and tools are needed. We will also identify links with the co-management of resources under the Treaty of Waitangi, and consider Māori perspectives on holistic natural resource governance.”
Three inter-related research objectives aim to provide a holistic view of ecosystem service management:
Objective 1: developing methods to assess and map ecosystem services nationally.
Objective 2: developing methods to explore future changes in national land use patterns and implications for the composition and availability of ecosystem services
Objective 3: integrating multiple ecosystem services into planning and policy decisions and reporting protocols.
Further information:
John Dymond
Web: www.ecosystemservices.co.nz