Monitoring agricultural land use with time–series satellite images
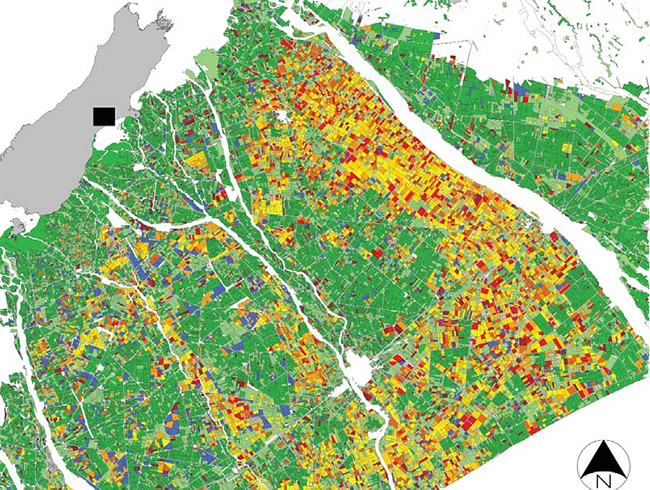
New remote sensing technology has been developed at Landcare Research to map paddock boundaries and identify the agricultural land uses within them. Satellite images are used, so a large area (approximately 60 x 60 km) is covered in a single map (Figure 1). If suitable time series of images can be acquired, regular update and change-tracking of land uses are possible.
The aim is to enable regional statistics to be gathered, such as the areas of various land-use types and their change over time. The maps of land use and crops can also be laid over other spatial data, for example soil maps, to see what land uses are occurring on what soils, or to carry out other environmental modelling.
With support from Environment Canterbury, researchers have so far mapped the Mid-Canterbury area around Ashburton on three dates: Summer 2010/11, Winter 2011, and Summer 2011/12 (this is shown in Figure 1). Image sequences are currently being acquired in South and North Canterbury for further mapping. In a separate project, winter forage paddocks have been mapped for a study site in Southland.
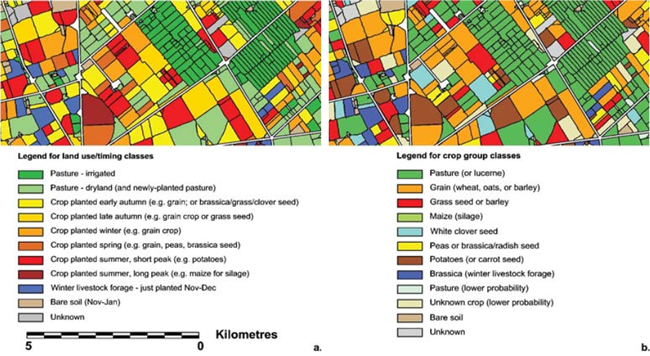
Figure 2 shows the paddock-level detail within the maps, and also the map legends for a summer classification. The groups of narrow (100-m-wide) pasture paddocks (green) are characteristic of modern dairy farms in Canterbury, and the larger paddocks in the yellow-red colours are cropping paddocks. Rivers, towns, forests, sea, and hill-country have been masked out (white). The full map area contains some 58 000 paddocks.
The land use picture in Canterbury is complex, with a huge range of grain and seed crops, forages, and pastoral farming. The new methods enable broad land uses to be mapped: permanent pasture, summer arable crop, winter forage crop, and bare soil (for an extended period). These can then be further broken down into crop groups (e.g. grain crops, grass seed + barley, maize for silage, peas + brassica/radish seed, forage brassica) and by timing (e.g. planted in early autumn, late autumn, winter, spring, or summer).
Crops often cannot be identified reliably from an individual satellite image because, at any given date, many look very similar – green vegetation with only subtle differences. Therefore, we use a time series of satellite images to track the timing of planting (bare soil), full leaf cover, and harvest (stubble or bare soil) in each paddock, and then refine the identification using the spectral appearance when the crop is at full leaf cover. In the case of permanent pasture (or lucerne), we expect the paddock to remain largely green over at least 12 months, with occasional, short dips in ‘green-ness’ due to grazing, mowing, or lack of moisture.
The researchers believe these land ‘use’ classes are more relevant to questions of environmental impact than are specific ‘crop’ classes. For example, oats may be grown as a summer arable crop for grain, OR it may be grown as a winter livestock forage. The possible impacts on soil and/or groundwater of a summer arable crop are quite different from those of a winter forage crop, so there is more value in this distinction than in specifically knowing that the crop is oats.
The authors thank Zach Hill and Jeromy Cuff at Environment Canterbury for ongoing support and encouragement.
Heather North – Contracted To Landcare Research
P: 03 325 3381 E: northh@xtra.co.nz
David Pairman, Stella Beliss – Landcare Research
Figure 1. Land use classification for Summer 2011/12, Mid-Canterbury. Shades of green are pastoral types, yellow/orange/red shades are single-season crops, and blue indicates winter forage paddocks already planted in November–December. Rivers, towns, etc., are masked out (white).
Figure 2. Enlargement of the Summer 2011/12 classification, showing paddock-level detail, and the two types of information produced by the classification: (a) land use timing, as also shown in Figure 1; (b) crop group.