Digging a bit deeper: understanding survey participation rates
The apparent increase change in tūī per garden appears to be mostly an artefact of the changing proportion of respondents, especially from Canterbury.
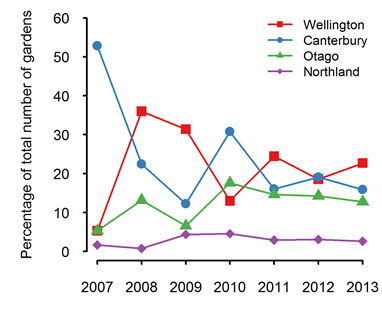
Let us consider for a moment where the survey respondents came from each year (Figure 1). In 2007, more than 50% of the surveys were from Canterbury. This percentage dropped in 2008 and again in 2009, rising to 30% in 2010, and then remaining somewhat consistent from 2010 to 2013.
When we compare the mean tūī per garden (Figure 2) to the percentage of total gardens from Canterbury (Figure 1), the two lines practically mirror each other – when the percentage of survey returns from Canterbury is high, the mean tūī per garden is low, and vice versa.
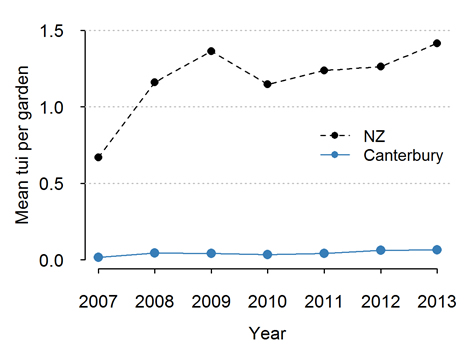
This is not surprising when we look at the mean tūī per garden from Canterbury only (Figure 3). Tūī are relatively uncommon in Canterbury, with results from the GBS indicating a regional average of only 0.05 tūī per garden. More importantly, the results do not appear to change over time.
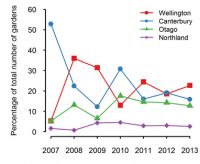
Figure 1: The percentage of total survey returns by region (Data source: Garden Bird Survey).
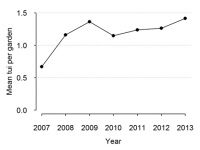
Figure 2: The average number of tūī per garden for New Zealand (Data source: Garden Bird Survey).
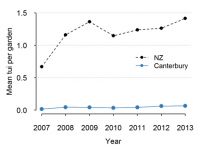
Figure 3: The average number of tūī per garden for New Zealand and Canterbury only. (Data source: Garden Bird Survey).

| « Calculating the national average | Next section » |