How to reduce the noise?
Accounting for sources of noise in the data can make it easier to detect the signal.
In order to identify the trend (i.e. the true underlying change in the population), we must account for those factors that may be influencing the observed counts but not the actual trend itself. Doing this removes some of the noise in the data making it easier to detect the signal.
Accounting for sources of noise
As we have seen, two important factors are the Region where respondents live and whether the Garden Type is rural or urban.
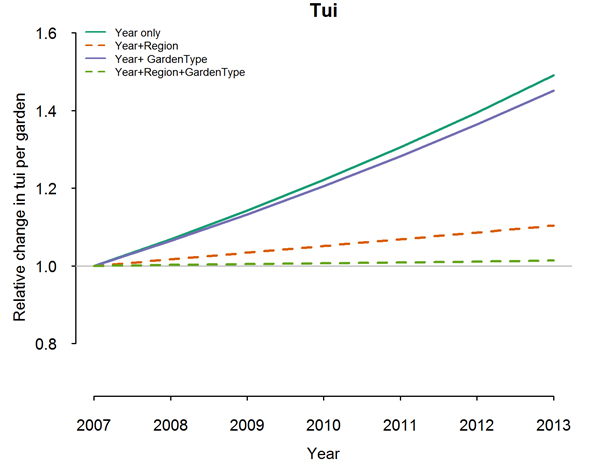
To illustrate the effects of accounting (or not accounting) for various factors, we calculated the trend four different ways:
- We ignored the effects of region and garden-type (denoted as Year only)
- We accounted for region but not garden-type (Year+Region)
- We accounted for garden-type but not region (Year+GardenType)
- We accounted for both region and garden-type (Year+Region+GardenType).
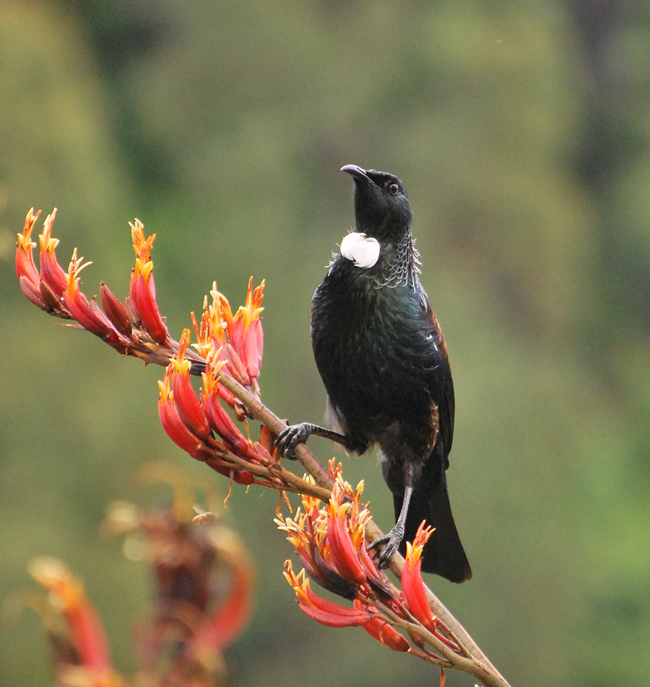
Example: Changes in tūī abundance in gardens
 For tūī, the annual trend based on the raw data (Year only) suggests that tūī have increased in abundance in gardens at a rate of approximately 7% per annum. This reflects what we observed in the Figure below.
When we account for region (Year+Region), our best estimate of the increase in tūī abundance is only 2% per annum (see Figure).
When we also account for Garden Type in addition to Region (Year+Region+GardenType), there is even less evidence of a change in tūī abundance.
This analysis suggests that any apparent increase in tūī abundance based on the mean counts per garden is predominantly due to annual changes in the survey returns from different regions and from garden types.
A note of caution
It is important to note that there are likely to be other factors not yet accounted for.
The salient point is that any apparent trend in abundance from the Garden Bird Survey may be due to issues related to sampling as opposed to changes in underlying abundance.
| « Reading signals from noisy data? | Next section » |