Skip to main content
How many working farms/forests/growing operations have you visited in the last 12 months?
How many working farms/forests/growing operations have you visited in the last 12 months?
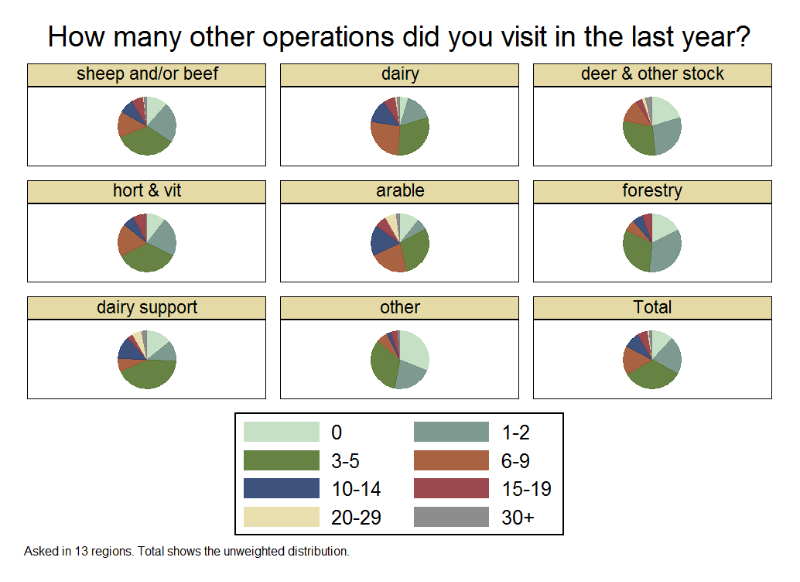
Data by primary land use
| Primary land use | 0 | 1-2 | 3-5 | 6-9 | 10-14 | 15-19 | 20-29 | 30+ | Total |
|---|
| sheep and/or beef | 11.67 | 22.48 | 35.01 | 14.27 | 7.93 | 6.34 | 0.58 | 1.73 | 100 |
| dairy | 4.89 | 15.29 | 30.89 | 26.61 | 13.15 | 6.73 | 0.92 | 1.53 | 100 |
| deer & other stock | 20.37 | 27.78 | 29.63 | 12.96 | 0 | 3.7 | 1.85 | 3.7 | 100 |
| hort & vit | 10.18 | 22.16 | 35.33 | 17.96 | 6.59 | 7.19 | 0 | 0.6 | 100 |
| arable | 10.64 | 6.38 | 29.79 | 21.28 | 17.02 | 6.38 | 6.38 | 2.13 | 100 |
| forestry | 17.74 | 33.87 | 30.65 | 6.45 | 5.65 | 5.65 | 0 | 0 | 100 |
| dairy support | 14.29 | 11.43 | 42.86 | 7.14 | 12.86 | 2.86 | 5.71 | 2.86 | 100 |
| other | 30.86 | 22.22 | 33.33 | 6.17 | 2.47 | 3.7 | 0 | 1.23 | 100 |
| Total | 11.96 | 21.04 | 33.76 | 16.05 | 8.63 | 6.07 | 0.96 | 1.53 | 100 |
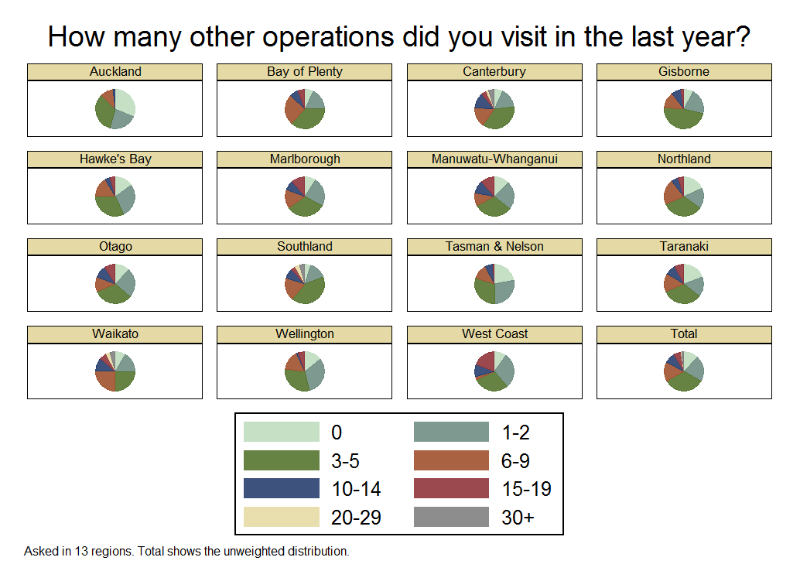
Data by region
| Region | 0 | 1-2 | 3-5 | 6-9 | 10-14 | 15+ | Total |
|---|
| Auckland | 31.25 | 22.92 | 33.33 | 10.42 | 2.08 | 0 | 100 |
| Bay of Plenty | 7.14 | 17.86 | 36.9 | 25 | 7.14 | 5.95 | 100 |
| Canterbury | 6.83 | 16.19 | 36.69 | 16.55 | 12.59 | 11.16 | 100 |
| Gisborne | 7.89 | 21.05 | 47.37 | 13.16 | 7.89 | 2.63 | 100 |
| Hawke's Bay | 15.27 | 27.48 | 32.06 | 16.79 | 3.82 | 4.58 | 100 |
| Marlborough | 8.99 | 23.6 | 32.58 | 15.73 | 7.87 | 11.24 | 100 |
| Manuwatu-Whanganui | 12.5 | 23.08 | 31.73 | 10.58 | 10.58 | 11.54 | 100 |
| Northland | 18.07 | 16.87 | 33.73 | 20.48 | 6.02 | 4.82 | 100 |
| Otago | 12 | 24.5 | 32 | 12 | 10.5 | 9 | 100 |
| Southland | 5.22 | 14.18 | 41.79 | 18.66 | 8.21 | 11.94 | 100 |
| Tasman & Nelson | 21.9 | 27.62 | 30.48 | 12.38 | 6.67 | 0.95 | 100 |
| Taranaki | 19.4 | 16.42 | 32.84 | 14.93 | 8.96 | 7.46 | 100 |
| Waikato | 8.62 | 17.24 | 25 | 24.14 | 11.21 | 13.79 | 100 |
| Wellington | 14.29 | 32.14 | 30.36 | 16.07 | 1.79 | 5.36 | 100 |
| West Coast | 9.68 | 29.03 | 29.03 | 3.23 | 9.68 | 19.35 | 100 |
| Total | 11.96 | 21.04 | 33.76 | 16.05 | 8.63 | 8.56 | 100 |