How rapidly do rat populations recover after control with 1080?
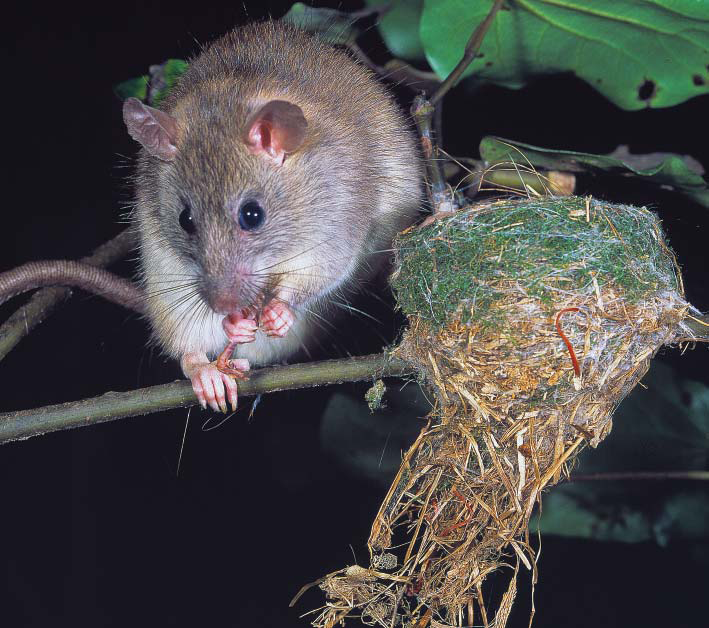
Image courtesy of Nga Manu Images.
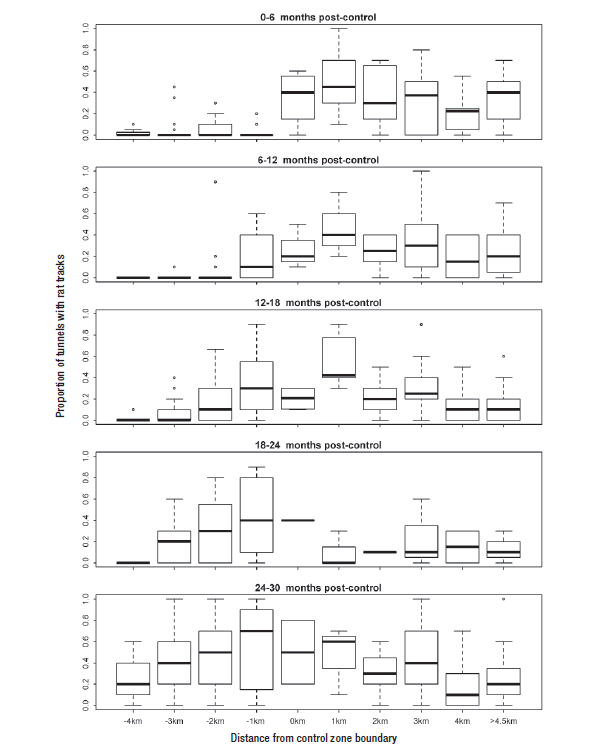
An aerial 1080-bait poison operation usually results in an immediate reduction in the number of possums and rats inside the baited area. But two critical questions are how far does this control extend and how fast do pest numbers recover across the entire control area? Landcare Research and the Department of Conservation (DOC) have been looking at these issues using data collected from DOC’s Project Kaka (the forest restoration initiative in Tararua Forest Park, controlled in November 2010) and from Greater Wellington Regional Council’s Hutt Water Collection Area (at the southern end of the Tararua Range, controlled in September 2009). Two to four times a year since the control operations, 65 lines of rodent tracking tunnels have been opened for one night and baited with peanut butter. The proportion of tunnels in a line of 10 with rat tracks in them is used as an index of rat abundance. Mandy Barron (Landcare Research) and James Griffiths (DOC) have been analysing these data for different patterns in the rates of rat recovery with respect to distance from the control zone boundary.
Overall, the 1080 operations achieved good kills of rats within the first 4 km of the control zone (−4 to −1 km) (see Fig.), with median tracking rates of zero recorded in the 6 months following control. The benefits did not, however, extend beyond the control zone; tracking rates on the border of the control zone (0 km: Fig.) remained high.
Recovery rates showed a consistent spatial pattern: rat tracking rates on lines just inside the control zone (−1 km) increased 6–12 months after control. Lines located 1–2 km and 2–3 km into the control zone showed delayed recovery rates at 1–1.5 years and 1.5–2 years respectively. Tracking on most interior lines (3–4 km) only recovered 2–2.5 years after control (Fig.).
Analysis confirmed a significant interaction effect – of time-since-control with distance from control-zone edge – on rat tracking rates, as illustrated in the figure. The analysis also showed that season has an effect on rat tracking rates – spring followed by winter had the highest rates. Lines at lower elevations generally had higher frequencies of rat tracking than lines at high elevations, but as this effect is similar to the effect of forest type (e.g. silver beech forest occurred at the highest elevations and harboured the lowest numbers of rats), the exact mechanism is unclear. There was also an unexplained (‘random’) effect of different years on rat tracking rates, which could have been due to year-to-year variation in fruiting or seedfall affecting rat productivity or yearly variation in weather affecting rat survival.
The spatial pattern of rat recovery observed, i.e. fastest at the control margins and slowest in the control interior, strongly suggests that such recovery was initiated by rats immigrating into the control zone from untreated parts of the forest where rats remained abundant. The alternative explanation, that productivity of rats surviving control was higher at the control margins and slower or delayed in the interior, seems unlikely given the control area boundaries were arbitrary and did not align with any changes in habitat or topography likely to affect productivity of rats.
The next step in the analysis is to look at the response of native species to changes in rat abundance. DOC has been monitoring birds in the control zone (using five-minute bird counts) and Landcare Research has been monitoring tree weta (using wooden ‘hotels’ nailed to trees), stick insects and tree weta (using frass collected in seedfall traps), and ground weta, beetles and spiders (using pitfall traps). The implications of the spatial patterns of rat recovery observed are that only species in the very interior of control zones are afforded long-term (>2 years) relief from rat predation.
The 1080 aerial baiting operation for the Project Kaka area was repeated in early December 2013 and further monitoring should show if the patterns observed after the second control operation are consistent with the first.
The work was funded by the Ministry of Business, Innovation and Employment (contract no. C09X0909) and the Department of Conservation.