Forecasts and ‘nowcasts’ of possum distribution in New Zealand
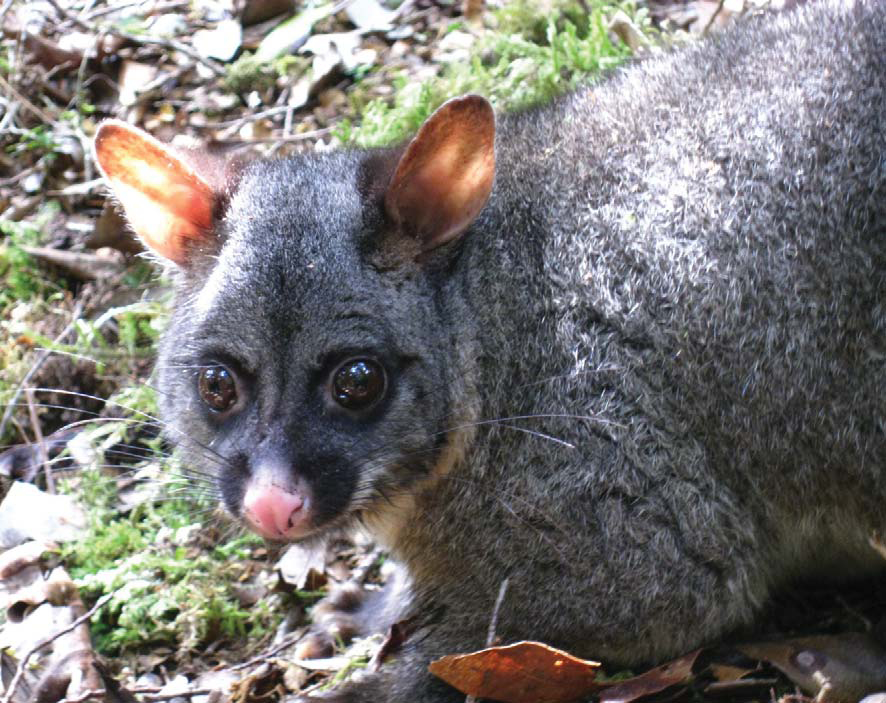
Image - Caroline Thomson.
Since their arrival in New Zealand in the mid-19th century, possums have colonised almost all areas of suitable habitat. Is there anything new to say about their distribution? The answer is yes: the abundance and distribution of possums in New Zealand changes continuously as a result of natural fluctuations in food supply, control programmes, and reinvasion and reestablishment of populations in previously controlled areas.
In the future, possum distribution is likely to change even more as regional councils expand control programmes across large areas (e.g. the Poutiri Ao o Tane project and the Cape to City proposal in Hawke’s Bay) or if the ‘Predator-Free New Zealand’ initiative gains traction. On the other hand, if TBfree New Zealand achieves success in eradicating bovine tuberculosis (TB) from many parts of the country, the need to suppress possum populations over large areas might have lower priority.
Recently, Bruce Warburton, James Shepherd and Phil Cowan estimated that control operations conducted by the Animal Health Board (now TBfree New Zealand), the Department of Conservation and regional councils had reduced New Zealand’s possum population, estimated at 48 million in 2009, by about one-third to a total of 30 million (see Kararehe Kino Issue 17). This assessment used habitat maps and the estimated carrying capacity of possums (i.e. the maximum density of possums in each habitat), taking into account suppression of possums through recent control operations. Keeping track of changes in possum distribution and abundance across New Zealand to provide up-to-date ‘nowcasts’ is possible through mapping data from repeated surveys. But these maps soon become outdated, either due to range contraction after habitat modification, pest control and eradication; or due to range expansion, for example via natural recolonisation of treated areas or deliberate or accidental releases in new areas.
In the case of possums, there are substantial demographic data and knowledge of ecological processes that drive population dynamics. So, current national maps of abundance and distribution can be combined with models of population dynamics to create dynamic maps showing future population trajectories. Murray Efford and Dave Ramsey (formerly with Landcare Research), and more recently Mandy Barron, designed a ‘spatial possum model’ that simulates the birth, movements and death of individual possums to predict the rate of recovery ofentire populations after control. Currently this model can simulate changes in possum populations up to about 100,000 individuals (i.e. over areas of about 10,000 ha) but above this number computational speed is slow, so the model is unable to deal with very large areas, e.g. at regional and national scales. James Shepherd and colleagues have overcome this difficulty by rewriting the model’s computer code in a more efficient programming language and running model simulations with every possum represented individually for the entire North or South Island. This implementation, called the‘National Possum Model’, is designed to run on a clustered computing system (i.e. many linked computers running in tandem) and takes advantage of the large-scale parallel processing and memory that this system makes available.
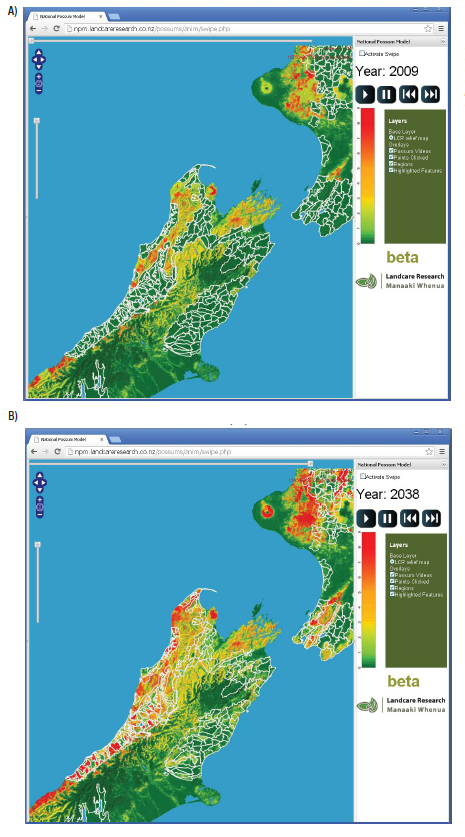
Other innovations make the dynamic maps intuitive so that they will be easy to use when the National Possum Model is made publically accessible via the Internet. Data are colour-coded so that areas of high and low possum density are easily distinguished. Maps consist of small ‘tiles’ and each of these tiles is sub-sampled at a number of different resolutions. Then the appropriate tile and resolution is chosen as the user zooms and pans around the map. To display changes over time, each tile at each resolution is turned into an animation showing an entire time series of the ‘most likely’ number of possums. Extra frames are introduced to make the animation look smooth enough for dynamic display. The result is a dynamic map predicting future changes in possum distribution and abundance anywhere in New Zealand and at any scale. Graphical overlays, such as vector control zones used by TBfree New Zealand, can be selected to provide additional spatial context and to generate outputs for areas of interest (Fig.).
The National Possum Model is still being developed to provide more functionality for managers. For example, one aim is to use it to compare scenarios with alternative management regimes (e.g. different control frequencies). Other developments will improve the model’s ecological realism by (1) using the recently-released land cover database (LCDB v 3.3) to update the underlying habitat map, (2) accounting for the most recent possum control operations conducted by TBfree New Zealand and the Department of Conservation, and (3) including new knowledge of possum movement patterns. For example, in a separate article in this issue Andrea Byrom describes recent results on rates of reinvasion of forest habitat by possums. Also, research in progress in dryland ecosystems by Carlos Rouco and Grant Norbury, and forest ecosystems by Peter Sweetapple, Dean Anderson and Graham Nugent, is quantifying how possums that survive control operations aggregate in favoured habitats or form social groups.
Ultimately, the aim of the National Possum Model is to improve strategic planning for possum control at regional and national scales. Also this model serves as a template for future dynamic maps ofother species.
This research was funded through core funding from the Ministry of Business, Innovation and Employment, and the localscale possum model was partially funded under contract to TBfree New Zealand.
James Shepherd, Sam Gillingham, Mandy Barron, Tim Heuer, Andrea Byrom and Roger Pech
Relevant publications:
Ramsey DSL, Efford MG 2010. Management of bovine tuberculosis in brushtail possums in New Zealand: predictions from a spatially explicit, individual-based model. Journal of Applied Ecology 47: 911–919.
Shepherd J, Pech R, Byrom A 2009. A prototype, web-based predictive model and decision tool for possums in New Zealand. In Proceedings of 5th International Conference on Mycobacterium bovis, Wellington, NZ, 25–28 August, 2009. P. 90.
Warburton B, Cowan J, Shepherd J 2009. How many possums are now in New Zealand following control and how many would there be without it? Landcare Research Contract Report LC0910/060, prepared for Northland Regional Council and the Animal Health Board. 15 p.