Behind the scenes | Calculating changes in bird counts
Common garden visitors
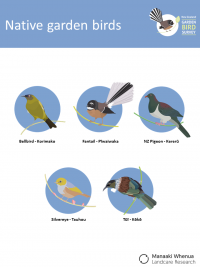
We have estimated how bird counts have changed since 2008 in different suburbs around New Zealand for 14 common garden visitors – five native and nine introduced bird species.
Survey effort changes over time
The number or proportion of gardens that are surveyed each year varies between different regions, towns and suburbs as illustrated with in the map and graphs below.
Dealing with noisy data
Our analyses use specialised statistical tools to account for this variation in sampling effort between regions, districts (or territorial authorities) and neighbourhoods within and between years. They also account for variation in bird counts depending on whether the surveyed gardens were in a rural or urban setting and if birds were fed or not. They also corrected for the actual number of gardens in each suburb.
Classifying changes in bird counts
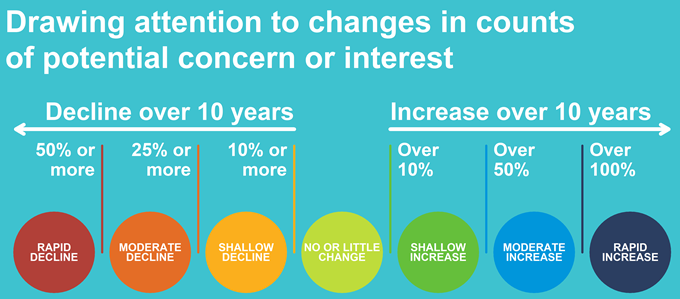
Our analyses calculate the percentage change in counts since 2008 and since 2013. We then classify these changes according to the direction and size of the change (see diagram below) to help us identify changes of potential concern or interest.

Confidence in the estimates
We used the 80% confidence intervals for the average percentage change to evaluate our confidence in our estimates. We generally have more confidence at the regional level than at the finer spatial levels of town/city and suburb. As the NZ Garden Bird Survey dataset grows over time, we expect that our confidence at these levels will grow – hence the more people that take part in the survey, the richer the picture we will have of the state of NZ garden birds.


