Financial performance summary

Orchids (Pike Brown)
$178,000 revenue per FTE (parent)
Summary table of group financial performance
| For the year ending 30 June: | 2013 | 2014 | 2015 | 2015 | 2016 |
|---|---|---|---|---|---|
| Achieved | Achieved | Target | Achieved | Target | |
| Revenue, $m | 55.5 | 54.7 | 58.7 | 58.22 | 59.2 |
| EBIT before investment, $m | 2.2 | 3.6 | 2.7 | 3.0 | 3.0 |
| EBIT, $m | 0.8 | 2.9 | 2.0 | 2.2 | 2.1 |
| Investment, $m | 1.4 | 0.8 | 0.7 | 0.8 | 0.8 |
| Total assets, $m | 45.5 | 45.4 | 45.3 | 47.7 | 50.0 |
| Return on equity | 4.1%1 | 7.2% | 5.0% | 5.5% | 5.0% |
| Dividend $m | - | - | - | - | - |
| Equity ratio | 61% | 63% | 72% | 66% | 66% |
| Gearing | 0% | 0% | 0% | 0% | 0% |
| Interest cover | 80 | 658 | 116 | N/A | 614 |
1 2013 Return on equity excludes extraordinary restructuring costs.
2 Revenue excludes income from gain on sale of subsidiaries and interest on investments and from finance leases, $0.2m for 2015 (2014: $0.1m).
Graphs
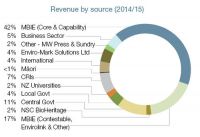
Graphs provide an indication of where our revenue comes from and where the revenue goes (expenditure). Graphs are not part of the audited accounts.

Revenue by source (2014/15)

Where our revenue goes (2014/15)

Subcontracts to research partners by sector
