Data collection and use by community-based pest managers
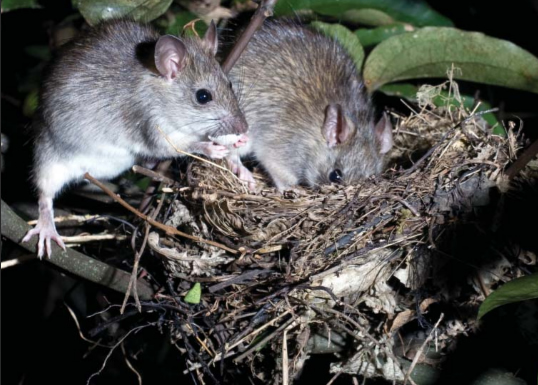
Controlling rats increases the survival of native bird populations. Here, two ship rats are predating eggs from a fantail's nest. Image - Nga Manu Images.
Why do volunteer pest controllers keep records? Apart from the satisfaction of documenting their sustained effort, the most likely reason is to demonstrate to themselves and others that they have made a difference in suppressing pests and reducing the damage they cause.
Roger Pech and his colleagues report that most pest controllers record either the number of pest animals killed or the amount of resources used to kill them. Some pests are killed by trapping or shooting, which provide direct counts of animals removed. Other techniques, such as poisoning, do not, so that any suppression of pest populations has to be inferred, e.g. from the amount of bait removed from bait stations. With either the direct or indirect method, it is essential to record ‘zeros’ (no kills or no bait taken) to track periods of low pest abundance. It is also necessary to record the total effort put into pest control because this will influence the kill rate. Then the ‘catch per unit effort’ (CPUE), which is the ratio of the catch (number of kills or amount of bait removed) to the control effort (number of traps or number of bait stations, multiplied by the number of days the devices are set), can be used as an index of the size of the pest population. When pests are more abundant, more animals are likely to be removed for a particular level of effort, i.e. CPUE is higher.
Invariably some individual pests are difficult to trap or avoid bait stations. Then the problem with CPUE as a measure of pest abundance is that it provides no information about the part of the pest population that is not trappable or is bait-shy. Ideally, pest populations should be monitored using a technique different to the control method. For example, rodents can be measured using tracking tunnels (tubes lined with inked paper to record animal tracks), and larger pests can be monitored using spotlight counts or movement-activated cameras. Measures such as CPUE or percentage of tracking tunnels showing animal activity providean index of pest abundance but not an estimate of population size. Often it is not necessary to know exactly how many pests are present in an area: an index of abundance will show whether the pest population is increasing, static, or decreasing (preferably to extinction).
Usually it is easier to measure changes in pest abundance than it is to measure the benefits from controlling them. However, an ability to demonstrate that pest damage has been reduced is essential because gaining benefit (e.g. in increased survival of native birds) is the primary motivation of pest control and, ethically, is one criterion to justify killing pest animals. Measures of conservation benefit typically include counts of bird species recorded per unit time, number of lizards under artificial covers, or number of wētā per artificial gallery (‘motel’). As with CPUE, it is essential to record the total effort for each recording session (e.g. number of 5-minute bird counts or number of wētā motels).
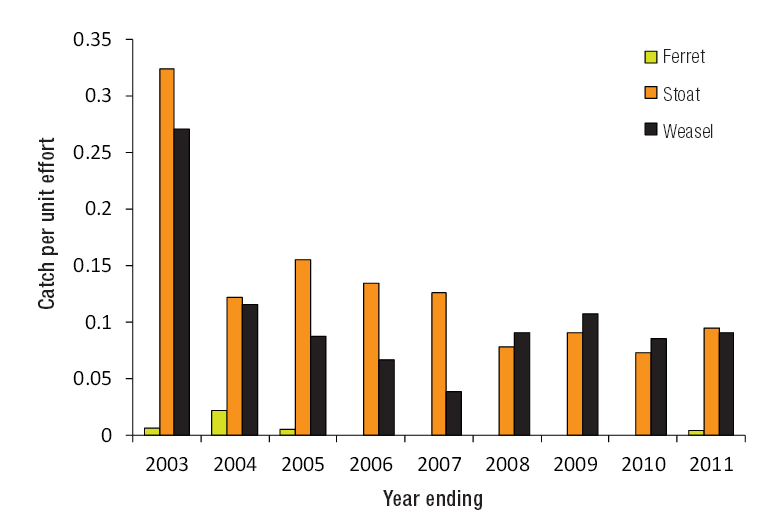
What information can be gleaned by pest managers from records such as CPUE and bird counts? Usually the data are plotted as a time-series. For example, figure 1 shows that CPUE for stoats and weasels at Whangarei Heads dropped substantially immediately after trapping commenced (www.backyardkiwi.org.nz) and has been held at consistently low levels since then. Similar graphs for other species may not show similar patterns. Roger expects species such as rats and mice would show much larger fluctuations between years because they can be affected more rapidly by favourable and unfavourable years. Records of the benefits of pest control also can be plotted as time-series. Figure 2 shows a steady increase in the number of kiwi calls per hour in the pest control area at Whangerei Heads.
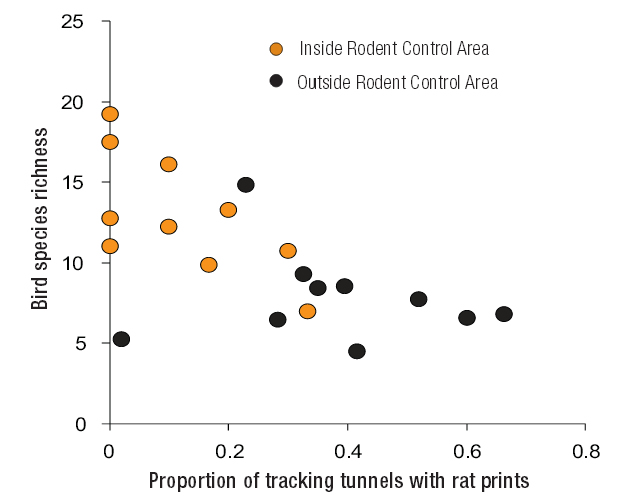
Graphs such as figures 1 and 2 provide some encouragement that a pest control programme is reducing pest numbers and producing real benefits for conservation. Simple re-plotting of the data can provide an insight into how much control effort is needed to be beneficial. Figure 3 shows data on rat abundance and bird species richness collected on BluffHill by the BluffHill/Motupōhue Environment Trust. The percentage of tracking tunnels with prints of rats is used to index rat abundance, and the number of bird species (‘species richness’) recorded for each monitoring session is the measure of conservation benefit. Figure 3 shows that few bird species are recorded when the index of rat abundance is above approximately 0.3. As rats are reduced below this level, there is a progressive increase in the number of bird species present, although even at low rat abundance there is still some variability in the bird species count. Figure 3 is an example of a ‘damage-density’ relationship: it provides an indication of how much the density of pests needs to be reduced in order to achieve measurable benefits. Graphs like this are useful for setting a target for pest control. In a similar way, data on the costs of control and monitoring, when plotted against indices of pest abundance or conservation benefit, can show how much needs to be spent to achieve effective control of pests and a desirable conservation outcome.
This work was funded by the Ministry for Science and Innovation (Programme CO9X0909) and MSI core funding to Landcare Research (‘Managing Invasive Weeds, Pests and Diseases’).
Roger Pech, Andrea Byrom & Al Glen
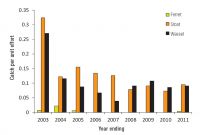
Fig. 1 Annual capture rates of invasive mustelids at Whangarei Heads from 2003 to 2011. (Redrawn from Glen et al. Conservation Evidence 9: 22–27).
![<strong>Fig.2</strong> Mean kiwi abundance (with 95% confi dence intervals) as indexed by hourly call rates at 12 listening stations on Whangarei Heads. (Redrawn from Glen et al. [see Fig 1].)](https://oldwww.landcareresearch.co.nz/__data/assets/image/0003/67800/varieties/thumb200.jpg)
Fig.2 Mean kiwi abundance (with 95% confi dence intervals) as indexed by hourly call rates at 12 listening stations on Whangarei Heads. (Redrawn from Glen et al. [see Fig 1].)
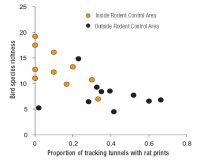
Fig. 3 Number of bird species and an index of rat abundance recorded at each monitoring session over 4 years by the Bluff Hill/Motupōhue Environment Trust in controlled and uncontrolled areas at Bluff Hill, Southland.
![<strong>Fig.2</strong> Mean kiwi abundance (with 95% confi dence intervals) as indexed by hourly call rates at 12 listening stations on Whangarei Heads. (Redrawn from Glen et al. [see Fig 1].)](https://oldwww.landcareresearch.co.nz/__data/assets/image/0003/67800/community_pest_fig2.jpg)