Back to the future: Soil mapping in a digital age
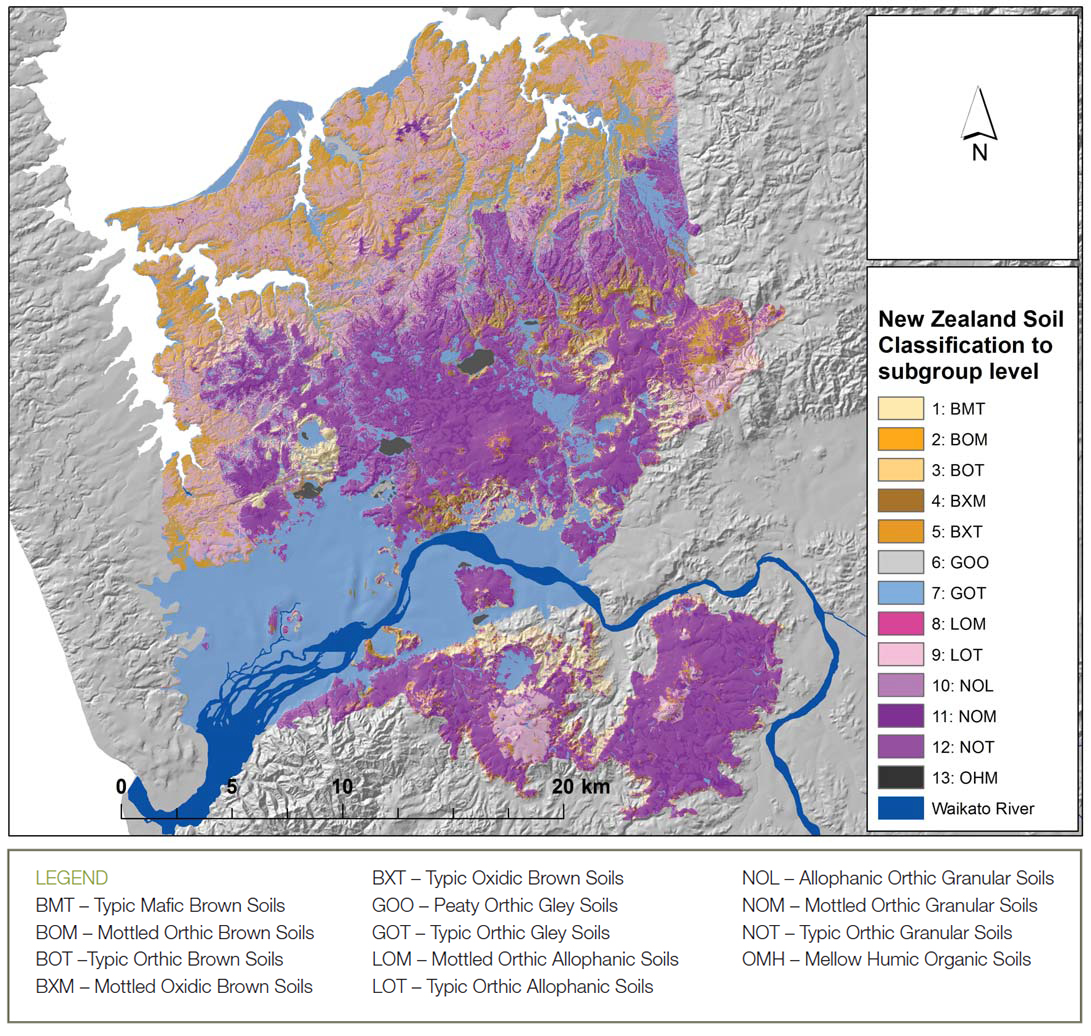
FIGURE 1A Digital soil map of the Franklin region.
Soil maps and the information they provide are fundamental not only to resource managers, but also to decision makers in local and central government.
Soils provide essential ecosystem services, including the production of food, fibre, and fuel, the provision of habitat, nutrient cycling, contaminant transformation, and water cycling. Generally in New Zealand, soil survey and mapping has been undertaken at map scales between 1:15 000 and 1:250 000, with S-map online requiring a minimum map scale of 1:50 000. More recently, land managers and regulators have shown interest in the development of maps at finer resolutions. With the advent of LiDAR we are now able to develop maps that represent the Earth’s surface at 5-m, 2-m, or even 1-m cell-size resolution (pixels). Add to this Landcare Research’s ability to predict soil chemical and physical properties from existing databases through S-map online, and we now have a powerful method to deliver high quality soil information not available before.
A field soil survey has traditionally been used to develop soil maps, and continues to be an essential part of mapping today. A soil survey involves collecting soil information across the landscape from soil pits, soil augering, road side cuttings, erosion scars, and describing their soil characteristics and properties. Soils are mapped across the landscape, based on the soil surveyors’ knowledge and conceptual ideas of where and how a soil occurs, using resources like aerial photographs. Digital Soil Mapping (DSM) and modelling follows a similar approach, except it builds quantitative statistical relationships between the soils observed and described, and maps representing the Earth’s surface. These maps may include attributes like slope, elevation, curvature, distance to streams, exposure to wind, areas of erosion, and landscape position on the Earth’s surface. Climate maps of rainfall, temperature, solar radiation, and soil moisture are also frequently used, as are maps of parent materials, and vegetation cover. The idea is that maps are chosen to represent the main soil forming factors: climate, organisms (including humans), relief, parent material, and time. As a generalised example, waterlogged, poorly oxygenated soils with pale subsoil colours are likely to occur in parts of the landscape where water accumulates (e.g. valley bottoms and in swales and hollows) (Fig. 1B), compared with well-drained soils that are more likely to occur on parts of the landscape shedding water (e.g. hill tops and ridges) (Fig. 1C&D).
In our mapping we used about 1300 observations across the Franklin region between Manukau Harbour and the Waikato River to predict subgroup soil classes at a 5-m cell size resolution (See Fig.1A). The main advantages of DSM over other mapping techniques are that the techniques are transparent, repeatable, and able to be up-dated (when more information becomes available), and that probability maps are provided along with model and validation statistics.
David Palmer, Scott Fraser, Sharn Hainsworth – Landcare Research

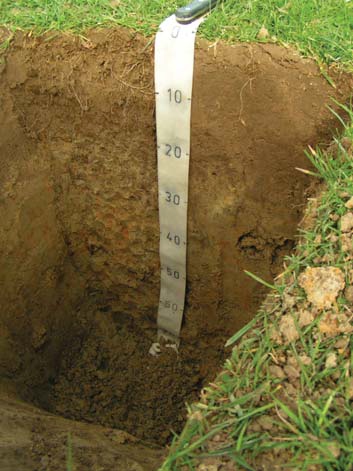
FIGURE 1B Representative soil profile: GOT — Typic Orthic Gley Soils (valley bottoms and in swales and hollows).

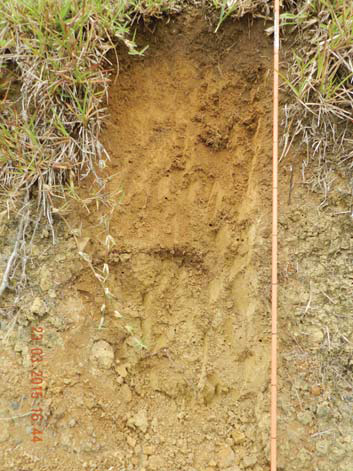
FIGURE 1C Representative soil profile: LOT — Typic Orthic Allophanic Soils (landscape shedding water e.g. hill tops and ridges).
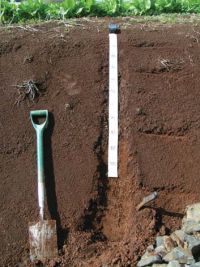
FIGURE 1D Representative soil profile: NOT — Typic Orthic Granular Soils (landscape shedding water e.g. hill tops and ridges).