2008 Results
Students from Kakanui School participating in the Garden Bird Survey.
The 2008 garden bird survey showed some interesting differences from 2007. The house sparrow was the most abundant species this year and the silvereye was second, the reverse of last year.
House sparrow numbers were up slightly (11.4 per garden this year compared with 9.4 last year) while silvereye numbers were down slightly (8.9 per garden this year compared with 10.2 last year). This is consistent with comments from several participants that silvereye numbers seemed to be lower this year. However, following announcement of this in the news media, a number of people contacted us saying that the silvereyes must be all at their place because they had lots of them!
There were other differences this year too. Chaffinch, tui, and dunnock appeared to be more common, and greenfinch, song thrush, and goldfinch less common. Tui moved from 11th most common bird last year (0.67 per garden) to 6th this year (1.2 per garden).
Top 10 birds per garden
|
2007 |
2008 |
||||
|
Silvereye |
10.2 |
House sparrow |
11.4 |
||
|
House sparrow |
9.4 |
Silvereye |
8.9 |
||
|
Starling |
3.1 |
Starling |
3.8 |
||
|
Blackbird |
2.7 |
Blackbird |
2.7 |
||
|
Greenfinch |
1.2 |
Chaffinch |
1.3 |
||
|
Song thrush |
0.98 |
Tui |
1.2 |
||
|
Chaffinch |
0.95 |
Dunnock |
1.1 |
||
|
Goldfinch |
0.87 |
Fantail |
0.88 |
||
|
Fantail |
0.86 |
Song thrush |
0.88 |
||
|
Dunnock |
0.79 |
Greenfinch |
0.87 |
||
In total, 81 bird species were detected in gardens this year, with an average of 7.3 species per urban garden and 10.1 species per rural garden.
Number of birds in gardens where birds were fed compared with not fed
As in 2007, there were many more birds of some species, such as silvereye and house sparrow, in gardens where they were fed compared to where they were not fed.
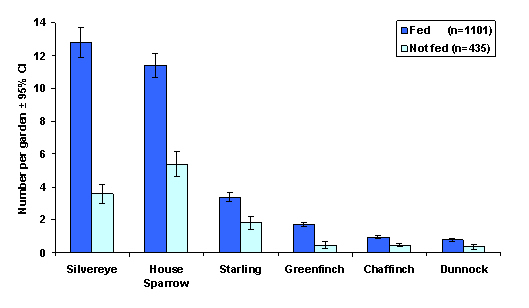 |
Birds were fed in 73% of gardens surveyed in 2008, compared with 68% of gardens in 2007. Birds were fed in a higher percentage of gardens in the south than in the north. Reasons for this are unclear, but perhaps related to more severe winters in the south.
Percentage of gardens in which birds were fed
| Region | Sample size | % |
| Northland | 17 | 41 |
| Auckland | 95 | 38 |
| Bay of Plenty | 37 | 51 |
| Waikato | 92 | 59 |
| Gisborne/Hawke's Bay | 49 | 61 |
| Taranaki | 16 | 69 |
| Manawatu | 107 | 76 |
| Wellington | 793 | 76 |
| Nelson/Marlborough | 184 | 69 |
| Westland | 34 | 62 |
| Canterbury | 678 | 79 |
| Otago | 296 | 84 |
| Southland | 16 | 75 |
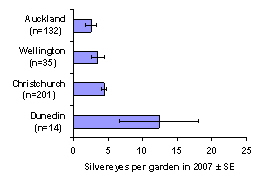
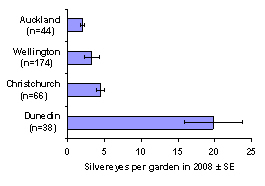
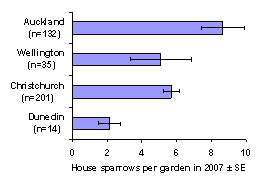
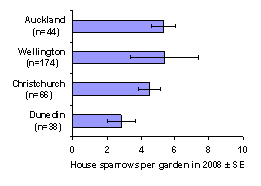
Regional differences in bird abundance
There were distinct regional differences in bird abundance in urban gardens. For example, silvereyes were much more common in Dunedin than in Auckland, in both 2007 and 2008.
 |
 |
On the other hand, house sparrows were much more abundant in Auckland than in Dunedin.
 |
 |
The bellbird (but not the tui) had a similar pattern to the silvereye, and the blackbird, song thrush, and starling had similar patterns to the house sparrow.
The apparent differences in bird abundance with latitude were not related solely to the provision of artificial food for birds. If this had been the case, house sparrows should have been more common in Dunedin than in Auckland, because they are fed in more gardens in Dunedin than in Auckland. To exclude the influence of feeding birds, the above graphs were constructed from data from gardens where birds were not fed. The apparent differences in bird abundance with latitude may be related to climate and/or habitat factors. For example, perhaps silvereyes prefer cooler and/or more vegetated towns and cities and house sparrows prefer warmer and/or less vegetated towns and cities.
Unusual birds
One of the more unusual birds recorded in gardens in 2008 was a stitchbird. Until 2005, stitchbirds were confined to offshore islands. They were introduced into the predator-proof-fenced Karori Wildlife Sanctuary in Wellington in 2005 and the Waitakere Ranges near Auckland in 2007.One survey participant living about 2 km from the Waitakere Ranges had a male stitchbird visiting her garden regularly during the period of the survey, feeding on fruit put out for birds.
Another unusual bird was a saddleback, recorded at a Mt Victoria address in Wellington, about 5 km from the Karori Wildlife Sanctuary, where saddlebacks were released in 2002.
Cats
Cats were owned by 38% of participants, on average 0.6 cats per household, or 1.5 cats per household that had cats. Some people made comments such as “my cat never eats birds”, “our cat is too fat and old to catch anything”, and “the cat can’t catch birds because it has only three legs and one eye and stays inside mostly”. One participant admitted, “Our cat takes the odd waxeye (silvereye). I hope this encourages the rest to breed mightily.”
The number of birds counted in gardens where participants owned cats was similar to the number in gardens where participants didn’t own a cat. Of course, these latter gardens were probably visited by neighbours’ cats. Thus, it is likely that most, if not all, gardens surveyed suffered from cat predation of birds.
Some people who didn’t own cats tried a variety of methods to dissuade neighbours’ cats from visiting, including “anti-cat and dog spray, which sometimes works” and a “cat-frightener that emits a high-pitched sound that humans can’t hear”. One respondent even suggested, “I may buy some lion poo from the zoo to discourage them.”
School grounds
As in 2007, the most abundant bird species in school grounds (including kindergartens and early childhood centres) in 2008 was the house sparrow. However, the order of other species changed slightly from 2007 to 2008.
Top 10 birds per school
|
2007 |
2008 |
||||
| House sparrow | 12.2 | House sparrow | 15.7 | ||
| Silvereye | 4.3 | Blackbird | 4.9 | ||
| Blackbird | 3.5 | Silvereye | 3.2 | ||
| Song thrush | 2.1 | Starling | 1.9 | ||
| Starling | 2.0 | Song thrush | 1.7 | ||
| Rock pigeon | 1.9 | Fantail | 1.7 | ||
| Fantail | 1.5 | Red-billed gull | 1.5 | ||
| Red-billed gull | 1.3 | Greenfinch | 1.2 | ||
| Myna | 1.2 | Tui | 1.2 | ||
| Black-backed gull | 0.7 | Myna | 0.9 | ||
The teacher at one school that also participated last year said, “Once again the children thoroughly enjoyed taking part. Graphs of the results are already displayed in the classroom and we were able to compare this year’s findings with last year’s. There were interesting viewpoints in the discussions as to why the results were similar in some cases and quite different in others.”
Number of participants
There were 2354 participants in 2008, compared with 2067 in 2007. Of the total, 2213 were in home gardens, 81 in parks, 49 in school grounds, and 11 in other locations. This year, 36% of returns came from Wellington (cf. 5% last year) and 22% from Canterbury (cf. 52% last year).
People were again very enthusiastic in their response to the survey. There were lots of comments such as “I love birds”, “we get a lot of enjoyment watching our feathered friends”, and “they are so amazing and fill my life with sheer joy every single day”. One lady said, “I’m 94 and have fed and watched birds all my life.”
A retirement home in Christchurch incorporated the survey into their weekly outing. They took afternoon tea to the Groynes, some binoculars, bird books to identify species, and stale bread from the kitchen. Apparently, everyone had a great time and one resident even spotted two “lovebirds” (a couple kissing on a bench).