2010 Results
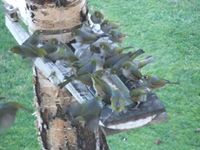
Silvereyes at sugar-water feeder. Image - Deborah Barron
A record 4193 gardens were surveyed this year, about twice as many as in previous years. In total, 187,858 birds were counted (an average of nearly 45 birds per garden).
In the species pecking list, silvereye returned to the top of the table after two years in second place, with a total of 55,543 counted, at an average of 13.2 per garden (Table 1).House sparrow was second (52,779 counted), starling third (11,837), and blackbird fourth (11,156). These species have been the top four in all four years of the survey. As in previous years, the only other native species apart from silvereye to make the top 10 were tui and fantail.
Table 1 Top 10 garden birds in 20101
| Species | Number | |
| Silvereye |
13.2
|
|
| House sparrow |
12.6
|
|
| Starling |
2.8
|
|
| Blackbird |
2.7
|
|
| Chaffinch |
1.2
|
|
| Greenfinch |
1.2
|
|
| Tui |
1.2
|
|
| Fantail |
1.0
|
|
| Goldfinch |
1.0
|
|
| Song thrush |
0.8
|
1 Average number counted per garden, calculated from total number of birds counted divided by total number of gardens surveyed
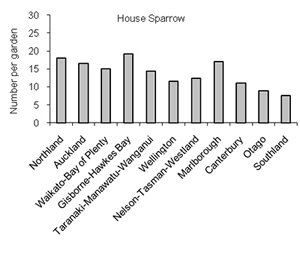
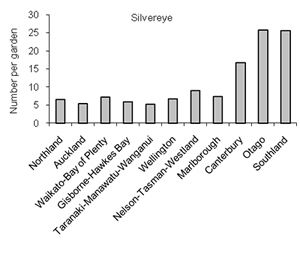
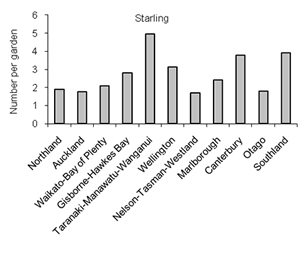
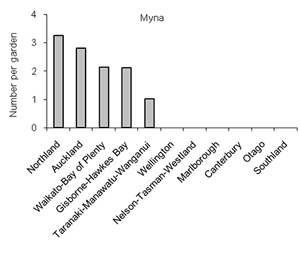
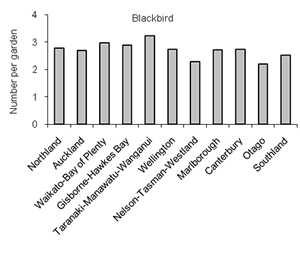
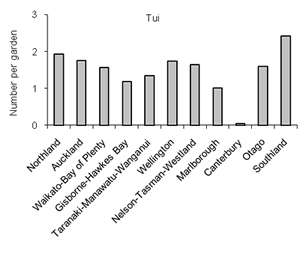
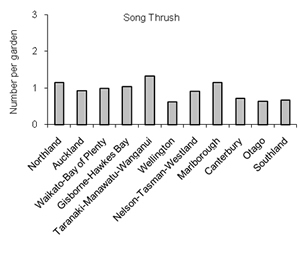
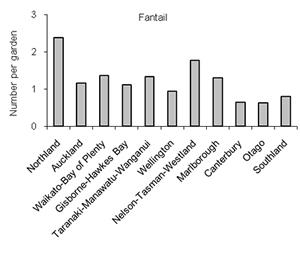
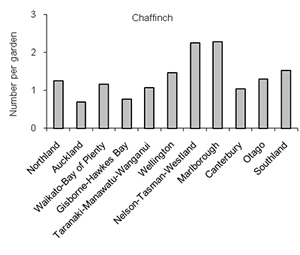
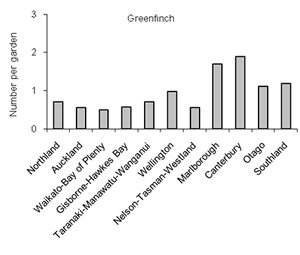
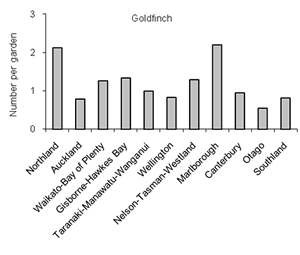
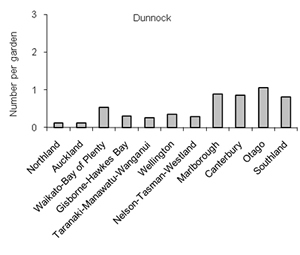
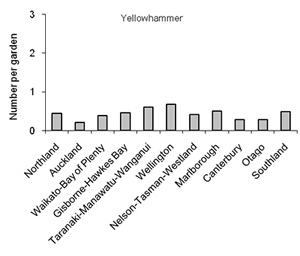
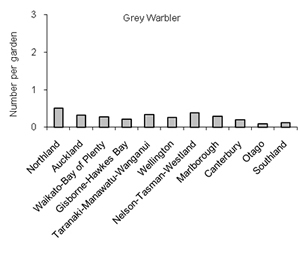
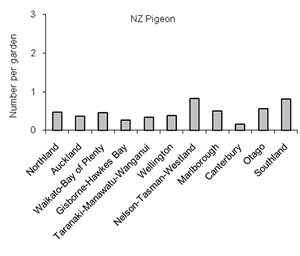
The results varied in different regions of the country. For example, silvereye was the species counted in greatest numbers in Southland, Otago, and Canterbury but house sparrow was counted in greatest numbers in all other regions (Figure 1). Myna did not make the top 10 nationally this year but was the third most commonly counted species (behind house sparrow and silvereye) in Auckland and Northland (Figure 1).
 |
 |
 |
 |
 |
 |
 |
 |
 |
 |
 |
 |
 |
 |
 |
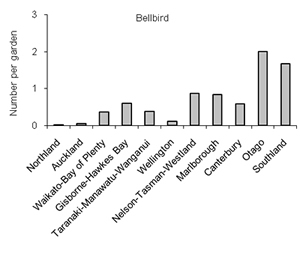 |
| Figure 1 Average number of birds counted per garden for selected species in different regions of the country in 2010. | |
Regional variation in bird counts highlights a problem – how to ensure regional representativeness in national averages. Because of regional variation, the number of survey returns received from the different regions influenced the total number of birds of each species counted nationally. Furthermore, the number of survey returns received from each region was not in proportion to the number of households in each region (as determined by Statistics New Zealand in 2006).
Most survey returns (30%) came from Canterbury (which had 14% of New Zealand households), 17% came from Otago (5% of households), 13% from Wellington (12% of households), and only 11% from Auckland (30% of households). Assuming the percentage of gardens in each region was roughly proportional to the percentage of households in each region, Canterbury and Otago gardens were over-represented and Auckland gardens under-represented in the national average counts of each species. To overcome this problem, regional average counts were multiplied by the proportion of households in each region and summed to obtain a weighted national average for each species. This made house sparrow the most numerous and silvereye the second most numerous species counted nationally (Table 2). This was because house sparrow counts were higher than silvereye counts in most regions of the country, including the largest region, Auckland, which contributed most to the weighted national average. It also made myna the 5th most numerous species counted nationally and caused greenfinch to drop out of the top 10. This was because myna counts were higher in Auckland than in Canterbury, for example, where it is absent, and greenfinch counts were lower in Auckland than in Canterbury (Figure 1).Table 2 Top 10 garden birds in 20102
| Species | Number | |
| House sparrow |
14.2
|
|
| Silvereye |
9.1
|
|
| Blackbird |
2.8
|
|
| Starling |
2.6
|
|
| Myna |
1.5
|
|
| Tui |
1.4
|
|
| Fantail |
1.1
|
|
| Chaffinch |
1.1
|
|
| Goldfinch |
1.0
|
|
| Song thrush |
0.9
|
2 Average number counted per garden calculated from regional average counts weighted by regional proportions of households
Relative abundance or conspicuousness?
Are there really more house sparrow and silvereye than other species in our gardens? Or is it just that house sparrow and silvereye are more conspicuous and easier to detect than other species? I think the answer is a bit of both. House sparrow and silvereye are very conspicuous when they congregate in large numbers around supplementary food such as bread (house sparrow) and sugar-water (silvereye). They also feed out in the open, for example in the middle of lawns (house sparrow) or on feeding tables (both species). When not feeding they move around in large flocks searching for food, at least in winter. Starlings and blackbirds are also conspicuous birds. They are larger in size than house sparrows and silvereyes, feed in the open (e.g. in the middle of lawns), and are attracted to supplementary food (e.g. fat or bread). Starlings also occur in flocks. The lower numbers of starlings and blackbirds compared with the numbers of house sparrows and silvereyes counted in gardens is likely to be a result of lower numbers present, not lower conspicuousness. I have seen gardens with hundreds of house sparrows and silvereyes but despite intensive searching never one with hundreds of blackbirds.
Dunnock and grey warbler, two species that did not make the top 10 this year, tend to be solitary (like the blackbird) and keep close to cover, such as under or in amongst foliage. Consequently, they are less conspicuous than the house sparrow and silvereye. Also, they are not so well known to people as are the house sparrow and silvereye and so their numbers are likely to have been underestimated in the survey. However, I believe their numbers are also lower than those of the house sparrow and silvereye. As noted above, I have seen gardens with hundreds of house sparrows and silvereyes but never one with more than four grey warblers. Thus, while the counts of some species such as dunnock and grey warbler are likely to have been underestimated, I believe the order of the top 10 and even top 20 species roughly reflects the order of abundance of species in our gardens.
Urban compared with rural gardens
The counts of most species were lower in urban than in rural gardens (Figure 2). This may have been related to the size of gardens (e.g. urban gardens may have been smaller than rural gardens) or to the structure and diversity of gardens. However, counts of house sparrow, greenfinch, and red-billed gull were higher in urban gardens than in rural gardens. Rock pigeon and spotted dove counts (not shown in Figure 2) were also higher in urban gardens.
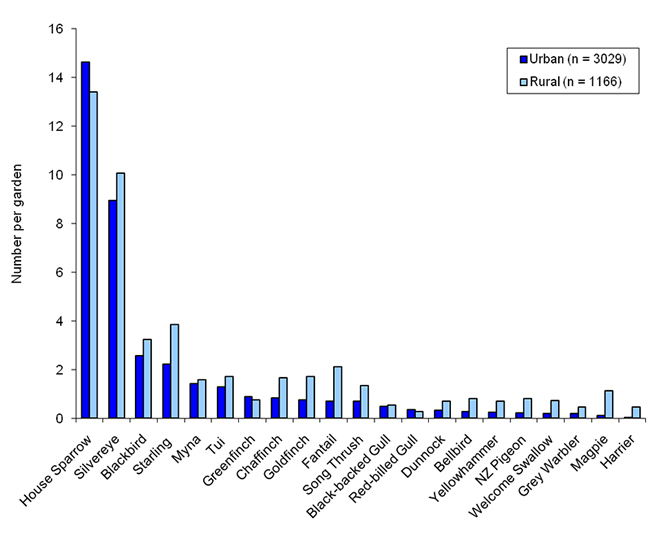 |
| Figure 2 Average number of birds per garden in urban and rural gardens (weighted by the regional proportions of urban and rural households). |
Effects of providing supplementary food
The counts of some species were higher and others were lower in gardens where supplementary food was provided (Figure 3). For example, counts of house sparrow and silvereye were more than twice as high in gardens where supplementary food was provided than where it was not. Other species with higher counts in gardens with supplementary food were starling, myna, greenfinch, chaffinch, dunnock, yellowhammer, and bellbird. These species are all attracted to supplementary food. On the other hand, counts of blackbird, tui, goldfinch, song thrush, fantail, black-backed gull, New Zealand pigeon, welcome swallow, magpie, red-billed gull, grey warbler, and harrier were lower in gardens where birds were fed than where they were not fed. This result is surprising for blackbird, tui, and goldfinch because they are attracted to supplementary food, and may be an artefact of inadequate weighting of the data. For example, the proportion of survey participants who fed birds in Canterbury was amongst the highest in the country but tui are very scarce in Canterbury (see Figure 1) and few were recorded at feeders, thus biasing the results. Ideally, the data should have been weighted by the proportions of households in different regions of New Zealand that fed birds but at present these proportions are unknown. Explanations for the lower numbers of other species are also speculative. Goldfinch, for example, is amongst the smallest of the finches and is often supplanted at seed feeders by the larger more aggressive greenfinch. This behaviour could have resulted in a reduced number of goldfinch counted in gardens with seed feeders. Fantail and grey warbler are insectivorous and not attracted to supplementary food, and lower counts of these species in gardens with supplementary food may have occurred because the large numbers of some other species attracted to the supplementary food (e.g. silvereye) had depleted the natural insect food supply. Alternatively, observers who provided supplementary food may have been distracted by the large numbers of other species attracted to the food and missed seeing the less common species such as fantail and grey warbler not attracted to the food. For the same reason, they may also have missed seeing species such as gulls, magpies, and harriers flying overhead.
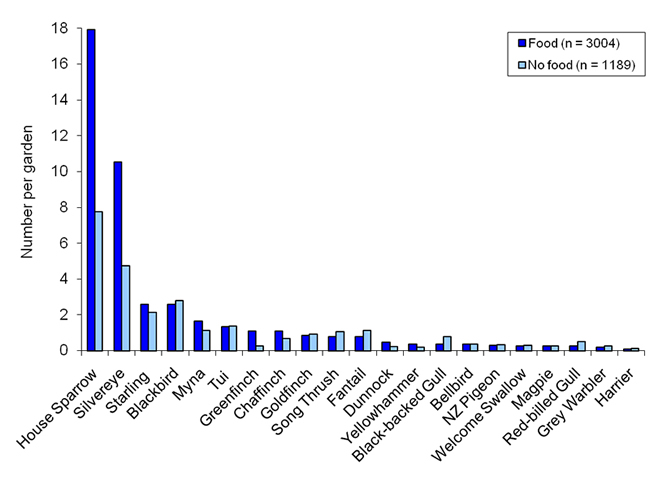 |
| Figure 3 Average number of birds per garden in gardens with and without supplementary food (weighted by the regional proportions of urban and rural households). |
Trends over the years
The counts of most species varied from year to year, but it is too soon to ascertain whether these changes are just part of a normal fluctuation in numbers over time or part of a long-term trend. Based on weighted regional average counts, the national average count of house sparrow increased over the 4 years (Figure 4). However, the average number of silvereye counted declined from 2007 to 2009 (the first three years of the survey) and then increased markedly in 2010. The decline from 2007 to 2009 occurred mainly in Otago and Southland, and mainly in gardens with sugar-water feeders, and may have been caused (or partly caused) by a disease called avian pox.
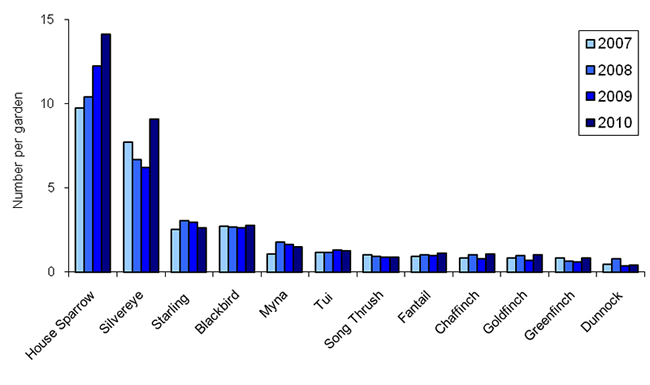 |
| Figure 4 Average counts of the 12 species that have occurred in the top 10 in one or more years, 2007–2010 (calculated from regional average counts weighted by regional proportions of households). |
Generality of the results
The results above apply to the gardens of participants but not necessarily to the gardens of New Zealand as a whole. This is because the gardens surveyed were not a random selection of gardens in New Zealand but were self-selected by volunteer participants in the survey who were probably more likely to be interested in birds, more likely to have bird-friendly gardens, and more likely to feed birds than the New Zealand population as a whole. The results could be made more general in the future by randomly selecting a large number of additional participants.
Conclusions
The results to date have shown large variations in bird counts between different regions of the country, between urban and rural gardens, and between gardens with and without supplementary food. These variations need to be taken into account when calculating national averages and national trends over the years. There were short-term trends in the counts of some species but it is too soon to report on long-term trends.
Some comments from participants
“Sparrows almost uncountable” (Waipu).
“In past surveys I have just made a guess about the number of house sparrows (I think last year I said 60). This year I had the idea of taking a photo while they were feeding on the seed I dispensed on the lawn. The numbers came to 103 give or take a feather or two!” (Rotorua).
“This year is very busy with the silvereye – they started 3 June and most were very small – now fully grown and looking great – there are lots more than previous years – our trees are very noisy! We go through 8 litres of sugar-water daily – they enjoy banana too. The sparrows love budgie seed and we need a constant visit to the supermarket!!” (Christchurch).
“Seems to be more silvereyes in my garden this year than last, and they arrived earlier, and I haven’t noticed anything wrong with them” (Dunedin).
“Silvereyes have increased dramatically this year. Last year they were noticeably lacking in our garden” (Queenstown).
“We put out a variety of food each day and it has been interesting to see who eats what and which birds ‘argue’. The greenfinches seem to tolerate the silvereyes but chase off other greenfinches and sparrows. The sparrows argue with each other and the silvereyes are constantly wings a-flitter at each other! The dunnock does well quietly pecking around on the ground under the food trays” (Motueka).
“Tuis appear to ‘own’ the red-flowering gum tree and chase away any intruder of any species. Bellbirds also eat there and in the grevillea. A huge flock of sparrows roosts in a neighbour's tree. Starlings nest in next door roof but I didn't see any today. Very enjoyable watching what the birds get up to!” (Auckland).
“Had tui here last year for the first time in 16 years of residence” (Hamilton).
“Saw my first bellbird ever in our street last week” (Hamilton).
“A kaka flew into our window and broke its neck a few weeks ago – we took it to the vet who identified it” (Napier).
“We live near Zealandia. It was pure magic to see wood pigeons in our trees. The kaka are usually in a flock of 3–5. They chase each other like boy racers and ‘laugh’. They are nocturnal too, which was a big surprise. Although we didn’t see any today, we have had saddleback in our garden. The tui chase them. The predator-proof fence and possum control have definitely made a difference. We started living here in 1986 and there’s been a marked increase in our garden birds” (Wellington).
“Twenty years ago the view from my kitchen window could at times, in autumn, show a flock of a thousand sparrows in the air at one time. Since the grapes came it has all changed. The tall gum and poplar trees have been cut down and nesting sites are removed from potential use. The grain fields are gone, the grain stores in town are gone or become a furniture shop, and the bakeries no longer make bread so the crumb food is no longer waiting on the ground. Sparrow numbers have been reduced to less than 1% of what they once were” (Blenheim).
“I really enjoy watching the birds feeding. The pecking order and what each species prefer. It would be a sad world if we didn't have the birds” (Invercargill).
“This survey was so much fun!” (Kerikeri).
Ancillary information
Of the 4193 survey returns received this year, about 30% were entered online by participants (Table 3). Forms printed in newspapers (The Press and Otago Daily Times) comprised 24% of the returns. As a percentage of the number printed in the two newspapers, the average return was about 0.74% from a total circulation of 133,000. In 2009, 380 returns came from the Dominion Post newspaper, about 0.4% from a circulation 98,000. Percentage returns from newspapers are not as good as from hardcopy handouts but newspapers reach a lot more people and have a higher total number of returns.
Table 3 Source of survey returns received in 2010.
| Source |
Number received
|
% received
|
Number distributed
|
% of those returned
|
||||
| Online data entry |
1280
|
30
|
-
|
-
|
||||
| Paper form printed from Web |
834
|
20
|
-
|
-
|
||||
| Newspaper form (The Press) |
617
|
15
|
90,000
|
0.7
|
||||
| Paper form handed out |
591
|
14
|
4,000
|
14.8
|
||||
| Forest & Bird magazine form |
430
|
10
|
14,000
|
3.1
|
||||
| Newspaper form (Otago Daily Times) |
362
|
9
|
43,000
|
0.8
|
||||
| Other sources (e.g. letter) |
79
|
2
|
-
|
-
|
||||
| Total |
4193
|
In addition to the above, there were about 100 returns from a variety of sources that were invalid (e.g. because only the presence of species not numbers of birds were recorded, or because the surveys lasted all day or all week not 1 hour, or because the surveys were done before or after the official survey period).
Acknowledgements
This survey was possible only thanks to the large number of volunteers who counted birds in their gardens. Thanks also to Landcare Research for promoting the survey, funding the printing of the survey form, and providing programmer and webmaster support; Forest & Bird, Ornithological Society, newspaper, radio, and television companies for promoting the survey; T. Marshall for designing the survey form; and about 40 volunteers for helping enter the data into the computer.