National annual trends

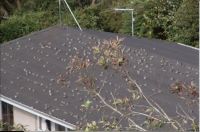
House sparrows on roof waiting to be fed. Image - R. McIntyre
Counts of most species have fluctuated from year to year, but most have not shown any consistent trend over the 8 years of the survey to date (corrected for regional variation in the number of survey returns) (see graphs below). For example, house sparrow counts increased over the first 4 years, but have levelled off since and now may be declining. Silvereye counts have probably fluctuated more than the counts of most other species, and seem to be particularly influenced by weather and disease such as avian pox.
Blackbird and song thrush are two species for which counts appear to have declined over the 8 years. However, this trend could change with more years’ data. There is no evidence of any significant trend in counts of starling, chaffinch, goldfinch, and greenfinch over the 8 years.
There is also no evidence of any significant trend in counts of most native bird species over the 8 years.
Of the introduced potential pest bird species, there is slight evidence of an increase in counts of eastern rosella and decrease in counts of magpie over the 8 years, but no evidence of any trends in counts of Barbary dove, spotted dove, rock pigeon, or myna.
Trends in bird numbers 2007 – 2014
(click on graph to enlarge)


