Coring through time
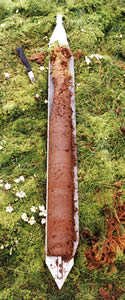 Sediment deposits have to be sampled by coring or digging pits to extract the pollen and spores for vegetation reconstruction. When exposed sections of sediment deposits are not available, then cores have to be collected from the surface of peatlands, using a coring device. The most commonly used corer for peat is the Russian D-section corer (PIC), which has a sharp penetrating point at one end, a movable sampling chamber inside a barrel, and a revolving fin along the length of barrel.
This coring head is attached to a T-bar handle and used with attachable extension rods that allow coring down to many metres depth. In New Zealand, most of the peat bogs we have cored have been between 1 and 12 metres deep, and began accumulating peat after the end of the last glaciation (c. 18 000 –10 000 years ago).The coring chamber is either 50 cm long by 5 cm diameter, or 100 cm long bby 10 cm diameter; the larger-dimension model is useful only in softer sediments. The corer is manually pushed into the peat surface down to the required depth, the handle is turned 180 dgrees, which forces the fin to slice and seal a semicylindrical sample of peat into the sampling chamber, preserving it in an undisturbed intact state. Then the whole unit is pulled up to the surface and the core of peat transferred from the sampling chamber into a piece of plastic guttering (PIC), wrapped and taken back to the laboratory for analysis and storage.
The cores may be subsampled (approximately a teaspoon of sediment will be removed from a horizontal slice of the core for analysis) at regular intervals down the length of the core, e.g. at intervals of 5 cm, or depending on the resolution required, this interval can be reduced to 5 mm for extra detail. The peat or lake sediments contain a matrix of dead plant remains, remains of insects, mineral materials, algal and fungal remains, along with pollen and spores.
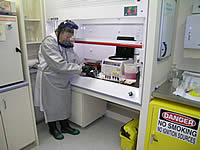 However, much time and effort is needed in the laboratory to chemically process the bulk sediment samples in order to destroy all the extraneous material and allow a pollen-rich residue to be produced. This residue should be clean and full of pollen, so that it can be mounted on a slide, allowing a representative sample of pollen and spores to be accurately identified and counted under a microscope. The number chemical analyses required relate to the removal of different components in the matrix of materials that enclose the pollen and spores. First, bulk samples are boiled in potassium hydroxide to break up the matrix and dissolve humic materials. The sample is then sieved to remove larger coarse roots and plant remains. Then hydrochloric acid is used to remove any calcium carbonate, followed by hydrofluoric acid to remove any silica from silt, sand or diatoms. Finally the residue is treated with an acetolysis procedure, which uses strong acids to remove cellulose. The tiny residue remaining after all this pretreatment is then stained to highlight and contrast the fine structures of the pollen walls, making identification easier. For each depth sampled in the core, pollen grains are counted until a sum of 250–500 pollen grains from terrestrial plants is counted. Counting is the most time consuming part of pollen analysis, and requires hours of sitting patiently at a microscope.
Creating pollen diagrams
Once the pollen slides have been counted, then pollen diagrams can be made, to express the results in a meaningful way. The pollen counts are converted to percentages of the total terrestrial pollen grains counted. Because sediments accumulate over time, and depth is a proxy for age, then the best way to assemble the pollen counts from each depth of a core is to plot them out as a long histogram, where the stratigraphically lowest and oldest samples are at the base, and the youngest, surface samples at the top. This way, the changes in vegetation cover at a site can be expressed over time.
Travis Swamp
 |
Pollen diagram showing initial human impacts on the vegetation is from a swamp core in Travis Swamp, Christchurch. A 50-cm peat core was extracted from the swamp. This was sampled for pollen every 2.5 cm down the length of the core. The pollen diagram has been divided up into four zones, which represent different periods of vegetation. Click to enlarge |