Monitoring soil climate in the Ross Sea Region
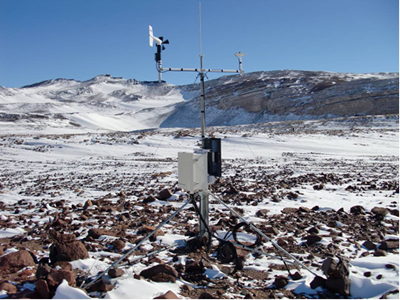
Mt Fleming climate station
Of the many climate stations in Antarctica, ours are among the few that monitor soil climate. In collaboration with the Natural Resources Conservation Service of the United States Department of Agriculture (USDA) we have established soil-climate stations (SCS) in the Ross Sea Region to examine/research the thermal state of the active layer and the permafrost, which are key indicators of climate change within the cryosphere.
Sites
We have seven soil-climate stations (SCS) and two permafrost temperature-monitoring boreholes. Four of the SCS border the Antarctic coast, two are in the McMurdo Dry Valleys, and one is on Mt Fleming at the head of the Wright Valley on the edge of the polar plateau (Figure 1). The permafrost boreholes are located within walking distance of the Marble Point and Wright Valley SCS.
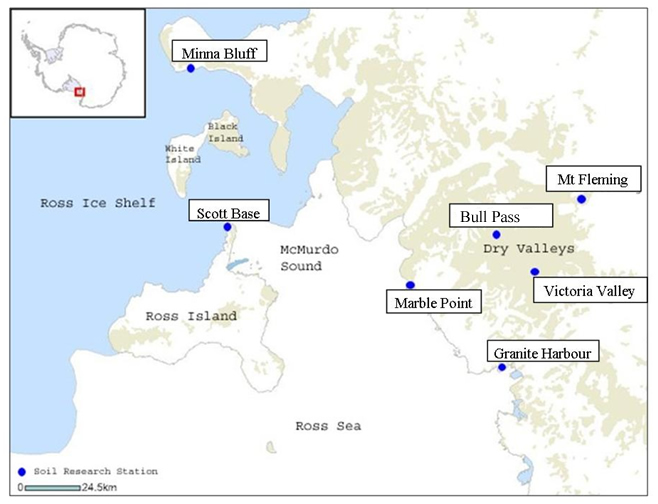 |
| Figure 1. Location of climate stations. |
Instrumentation
At each site, atmospheric and below-ground measurements, extending from the active layer into permafrost, are made on an hourly basis. Data loggers (CR10X, Campbell Scientific Inc.) are installed with sensors to record air temperature, relative humidity, solar radiation, and wind speed and direction. Thermistor temperature probes (Campbell 107) and Vitel moisture probes (Hydra type A, Stevens Vitel) are installed at depths of 2 cm – 1.2 m. Soil variables are measured every 20 minutes. All measurements are averaged and recorded hourly. At each locality, the instruments are replicated to provide information on variability. We visit sites annually for maintenance and downloading data.
Climate summary
Mean annual air temperature (MAAT) ranges from –17°C at Granite Harbour to –24°C at Mt Fleming (Table 1). Mean annual soil temperature (MAST) at 45 cm ranges from –15°C at Granite Harbour to –24°C at Mt Fleming. The MAST tends to be higher than the MAAT because the soil gets warmer than the air temperature during summer.
Mean annual relative humidity percentages ranged from 49% at Victoria Valley to 70% at Scott Base. The higher elevation and more inland sites are less humid than the coastal sites. Mean annual speeds ranged from 5 kph at Marble Point to 36 kph at Mt Fleming. Minna Bluff and Mt Fleming are the windiest sites, with Minna Bluff recording the greatest maximum hourly average wind speed of 160 kph.
The average water contents in the active layer of the soils are very low and tend to increase with depth. The four coastal sites are wetter on average in the active layer than in the Dry Valleys and at Mt Fleming. The maximum water content is around 34% by volume at 75 cm depth at Granite Harbour. The lowest average water contents (1–2%) are in the soil surface in the Dry Valleys.
The active layer is the seasonally thawed layer above the permafrost. The average maximum thaw depth ranged from 5.5 cm on Mt Fleming to greater than 88 cm at Granite Harbour.
Table 1. Mean annual averages for several parameters at each of the seven climate stations
|
Climate station
|
Elevation
(m) |
Air temperature
(°C) |
Soil temperaturea
(°C) |
Relative humidity
(%) |
Wind speedb
(kph) |
Average water content
in active layer (Vol %)c |
Average maximum
active layer depth (cm) |
| Granite Harbour |
5
|
–17
|
–15
|
61
|
6
|
6.0
|
88+
|
| Minna Bluff |
22
|
–19
|
–18
|
61
|
31
|
7.7
|
23
|
| Scott Base |
38
|
–20
|
–18
|
70
|
18
|
6.2
|
32
|
| Marble Point |
50
|
–18
|
–18
|
64
|
5
|
7.9
|
49
|
| Bull Pass |
152
|
–20
|
–20
|
–
|
14
|
1.4
|
45
|
| Victoria Valley |
412
|
–23
|
–23
|
49
|
8
|
1.7
|
22
|
| Mt Fleming |
1697
|
–24
|
–24
|
50
|
36
|
1.9
|
5.5
|
a Depth of soil temperature is 45 cm
b Maximum hourly average wind speed
c 2 cm depth
Significance of data and website
With up to 10 years of continuous monitoring for each site our database is becoming increasingly valuable and the value is increasing with the length of the record. Extensive analysis of the climate data provides the best available data on active-layer depth of soils in the Ross Sea Region and establishes an unexpectedly high level of between-season variability in active-layer depth and in the timing of maximum thaw within the summer season.
The climate data contribute to the international global programme Circumpolar Active Layer Monitoring (CALM) to help determine the impacts of global warming on permafrost stability. As climate models predict that the high altitudes will be most sensitive to changes, we provide observational data to test the models.
The data are available at http://soils.usda.gov/survey/scan/antarctica/index.html.