Economic aspects of New Zealand’s wild deer recovery industry

Red deer recovery
Red deer were introduced into New Zealand in the mid to late 1800s and are now almost ubiquitous across both the North and South Islands. The commercial recovery and export of venison from wild-caught deer began in about 1958, but the industry did not grow significantly until about 1963, when helicopters were first used to harvest deer carcasses from alpine grasslands.
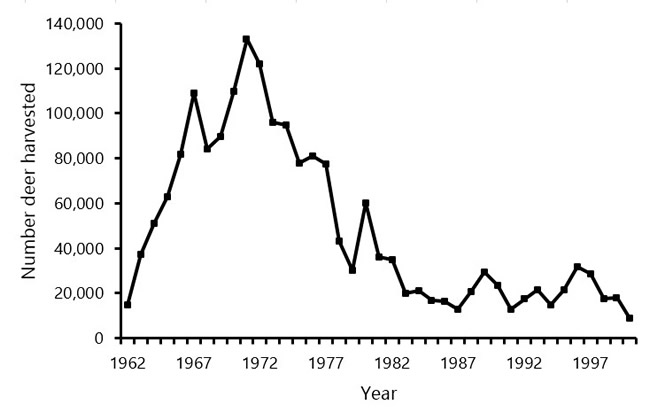
The wild deer recovery industry was highly competitive, with the number of deer harvested per year peaking at about 133 000 in 1972, and then declining to about 45 000 in the early 1980s, when live capture began to meet the demand for deer to stock farms (Figure 1). This new demand resulted in the price for a live hind (NZ$3,000 in 1979) far exceeding that of a deer carcass. As a result, helicopter hunting again became economic for two to three years, before the demand for live wild deer declined and the capture industry essentially ceased. The harvesting of deer carcasses continued at a lower level.
The impact of harvesting on deer density varied between habitats, with the greatest reductions occurring in alpine grasslands and the lowest reductions in low-elevation forests. In some areas deer populations were reduced by 90 to 95% (as measured by faecal pellet group densities).

Between 2002 and 2004 the export market for wild-caught deer declined substantially, but then increased and stabilised at c. 16 000 annually. However, since 2002 most processed deer carcasses have come from deer farms (Table 1).
Table 1. Number of farmed and wild-caught deer carcasses processed, 2002–2015 (source: AsureQuality – meat inspections)
| Year | Farmed | Wild |
|---|---|---|
| 2002 | 490 050 | 3227 |
| 2003 | 595 408 | 1173 |
| 2004 | 722 595 | 493 |
| 2005 | 814 446 | 2299 |
| 2006 | 774 081 | 3980 |
| 2007 | 627 031 | 9040 |
| 2008 | 633 739 | 17 978 |
| 2009 | 484 801 | 21 444 |
| 2010 | 407 387 | 16 065 |
| 2011 | 436 832 | 17 894 |
| 2012 | 438 371 | 17 309 |
| 2013 | 457 372 | 16 628 |
| 2014 | 447 264 | 16 144 |
| 2015 | 421 108 | 16 842 |
Since about 2004 the Ministry for Primary Industries has required all helicopter-based harvesters to use GPS to record their flight path and a waypoint for each deer shot. Because these data were readily available, Bruce Warburton, Dean Anderson, and Graham Nugent used them in a predator–prey functional response model to look at the deer densities required for helicopter operators to hunt profitably. The team obtained data from one helicopter operator flying an R44 helicopter at a cost of c. $1,200 per hour for 10 hunts (Table 2), and used them to generate a type II functional response model, relating capture rate to detectable deer density:
 where eq 1
F = per capita consumption rate (deer harvested per hour of helicopter time)
h = handling time (while gutting a carcass)
a = attack rate or rate of search (km2/h)
N = density of the prey (deer/km2)
Table 2. Parameters from GPS track logs and waypoints of deer killed from 10 hunts.
| Hunt | Total time | Handling time (h) | Search time | Deer harvested | Consumption rate (F) | Avg hunting speed (km/h) | Attack rate (a) |
|---|---|---|---|---|---|---|---|
| 1 | 4.85 | 1.80 | 3.05 | 40.00 | 8.70 | 54.40 | 10.90 |
| 2 | 6.70 | 3.20 | 3.50 | 73.00 | 10.90 | 40.10 | 8.00 |
| 3 | 6.50 | 2.00 | 4.50 | 70.00 | 10.80 | 53.50 | 10.70 |
| 4 | 5.10 | 1.50 | 3.60 | 68.00 | 13.30 | 77.10 | 15.40 |
| 5 | 6.95 | 2.38 | 4.57 | 40.00 | 5.70 | 57.30 | 11.50 |
| 6 | 5.30 | 1.40 | 3.90 | 14.00 | 2.60 | 87.30 | 17.50 |
| 7 | 3.90 | 0.50 | 3.40 | 19.00 | 4.80 | 101.60 | 20.30 |
| 8 | 2.42 | 1.00 | 1.42 | 29.00 | 11.90 | 45.50 | 9.10 |
| 9 | 2.75 | 0.63 | 2.12 | 25.00 | 9.10 | 58.60 | 11.70 |
| 10 | 2.50 | 0.83 | 1.67 | 25.00 | 10.00 | 70.80 | 14.20 |
To generate a value for attack rate, Bruce and his colleagues used the distance travelled per hour and an average search swathe width of 200 m (i.e. 100 m on each side of the helicopter). Because the team had no measure of detection probability, the density derived from equation 1 is the density of detectable deer, not the actual density. Based on the carcass price paid (averaged over 2005 to 2015; i.e. $220), a helicopter hunt needed to harvest five or six deer per hour to be economically viable. Of the 10 hunts for which data were available, only two had fewer kills per hour than this (Table 2).
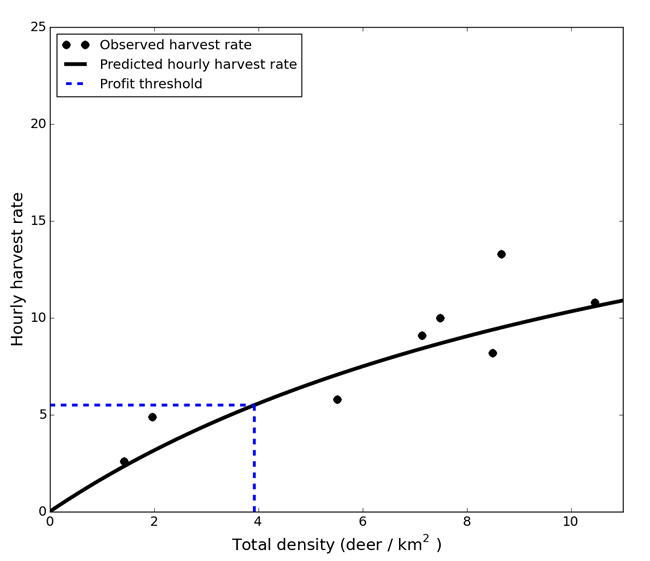
A functional response relationship between actual population density and hourly harvest rate (Figure 2) was established using historical faecal pellet count data, defecation rates, and harvest rates. It was found a harvest rate of 5.5 deer per hour (required for economic harvesting) was achievable in alpine habitats when deer densities are ≥4 per square kilometre (Figure 2).

The commercial red deer harvest industry has remained remarkably resilient in New Zealand. However, the demand for wild deer is largely influenced by the ability of farmed deer to supply the venison market. Because of a current shortage of farmed deer, the demand for wild deer has increased over the past 12 months.
The functional response modelling carried out for this analysis contained a number of assumptions:
- the attack rate was based on an assumed search swathe width of 200 m
- deer density was estimated using historical data on faecal pellet group density and harvest rates
- deer detectability was derived from the detectable density (not the actual density)
- helicopter operators need to fully recover their costs in every hunt.
The reliance on these (untested) assumptions highlights the need for their direct measurement to make the analysis more robust. For the last assumption, few, if any, helicopter operators are now solely reliant on wild deer recovery, and most are sustained by tourism and other commercial operations. As a result, operators can afford to harvest deer below its marginal cost, as long as their overall business is viable.
Most of the demand for venison can now be met from farmed deer, and demand for wild- caught deer is unlikely ever again to reach the levels seen in the 1970s and 1980s. Consequently, deer densities are likely to continue to increase in New Zealand, especially within forests. Where high deer densities occur in high conservation value sites, there may be an increasing need for some form of official agency-directed control. Conversely, in less sensitive areas there may be an opportunity to determine a sustainable yield for both commercial and recreational hunters. To ensure official control is optimised, the relationships between deer density and helicopter encounter and kill rates needs to be better understood.
The authors acknowledge the historical data collected and published by Chris Challies.
This work was funded by the Ministry of Business, Innovation and Employment.
Bruce Warburton
warburtonb@landcareresearch.co.nz
Dean Anderson
Graham Nugent
This study was fully reported elsewhere; see recent publications.
