Modelling supports nimble predator management for increasing kiwi populations over large areas
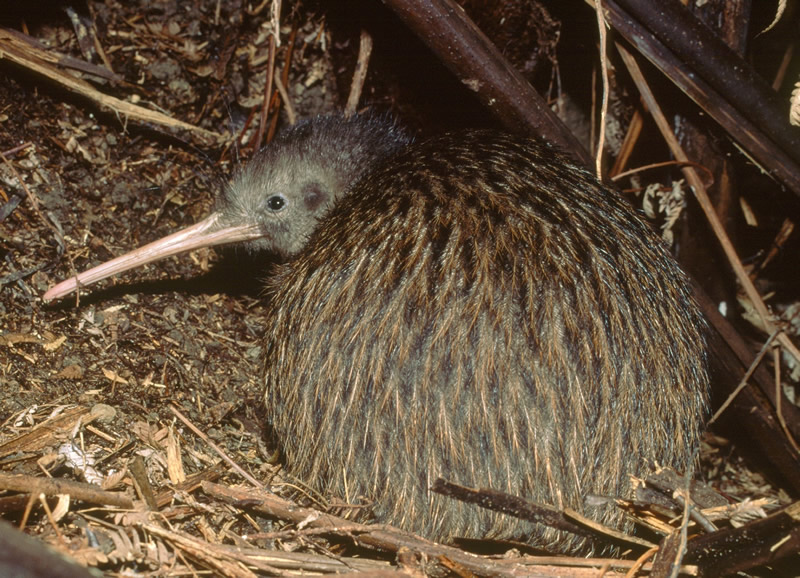
Brown kiwi. © Rogan Colbourne
The recovery of the five species of kiwi is a national conservation priority. The great spotted kiwi, tokoeka and brown kiwi live in large tracts of forest and are experiencing population declines due to invasive predators. While the little spotted kiwi and rowi have low populations, their numbers locally have stabilised or are increasing due to effective predator management. Kiwi chicks are vulnerable to predation by stoats until the chicks reach a weight of about 1 kg. In the face of unmanaged predator populations, kiwi recruitment is reduced or stopped, which results in population declines.
The level of stoat predation on kiwi chicks is the result of a complex multi-trophic system that begins with forest production of seeds (Figure 1). Periods of high seed production, such as during masting in beech forests, provides an abundant food resource for ship rat populations, which rapidly increase. The pulse of such populations provides a rich prey resource for stoat populations, which subsequently increase in density and put kiwi at risk.
Currently, baiting with1080 is the only cost-effective tool for controlling rats and stoats over very large areas, which must be done to reverse kiwi population declines. Stoats do not eat the 1080 baits, but 1080 acts to reduce the stoat population in two ways (as illustrated by the lack of an arrow from 1080 to stoats in Figure 1). First, stoats prey on rats that have eaten 1080 bait, and these ‘toxic rats’ act as a vector for getting 1080 into stoats, which then die from secondary poisoning. Second, baiting with 1080 reduces the rat population, which drives down the carrying capacity of stoats.

While the application of 1080 bait is relatively cost-effective, it cannot be applied everywhere and all of the time. Therefore, a strategy is required to guide when and where it should be applied to achieve a growing kiwi population. As a part of a Ministry of Business, Innovation and Employment-funded research project, Dean Anderson and John Innes have developed a broad-scale forecast model that captures the trophic dynamics of seed productivity, the rat and stoat populations, predator management with 1080, and kiwi population outcomes. The aim of the forecast model is to predict the likely change in kiwi population density over 20 years for a variety of alternative management strategies. The model incorporates stochastic forest productivity events (e.g. masts), dispersal and population growth of kiwi, rats and stoats and predation.
 Freeman Burn, (2) Mt Forbes, (3) Wet Jacket, and (4) West Cape.")
To illustrate the model, kiwi population dynamics were forecast across Fiordland National Park for 20 years in response to three different strategies for the deployment of 1080 bait. Predator management with 1080 cannot be conducted over the whole of Fiordland because of the costs involved, but it can be applied in management zones associated with the Department of Conservation’s programme Save Our Iconic Kiwi (SOIK; Figure 2). The first strategy is ‘reactive’, in which an aerial 1080 operation is triggered in a given management zone by either rat-tracking rates (recorded in inked tracking tunnels) of at least 20%, or by 50% of the management zone being found to be in mast. The second strategy is ‘4-year prescriptive’, in which each management zone receives a 1080 operation every 4 years, regardless of masting events or tracking tunnel rates. The third strategy is ‘3-year prescriptive’, in which a 1080 operation occurs in each management zone every 3 years. Importantly, 1080 is never deployed outside the four management zones.
The proportional change in kiwi population size over 20 years is forecast individually for each management zone and for all of Fiordland (see Table). For the reactive strategy, the proportional change in the kiwi population varied across the four management zones from 0.02 in Freeman Burn to 0.12 in Mt Forbes and West Cape. This management strategy reversed the decline of the kiwi population and resulted in an increasing population, but the 0.12 proportional change equates to a per-annum population growth rate of approximately 0.5%, which is well below the potential maximum growth rate of 10% and the SOIK goal of 2% per annum. The expected proportional change in the kiwi population over all of Fiordland was –0.15, which indicates an ongoing population decline, despite increases in the SOIK-managed areas. The expected number of 1080 operations over the four management zones and over 20 years was 29.4.
Table: Results of the forecast model for the three management strategies. Displayed is the mean proportional change in the kiwi population in the four management zones and over all of Fiordland National Park. Also shown is the expected number of aerial 1080 operations for each management strategy.
| Zone | Reactive | 4-year prescriptive | 3-year prescriptive |
|---|---|---|---|
| Freeman Burn | 0.02 | –0.01 | 0.02 |
| Mt Forbes | 0.12 | 0.01 | 0.11 |
| West Cape | 0.12 | –0.04 | 0.06 |
| Wet Jacket | 0.10 | –0.04 | 0.04 |
| All Fiordland | –0.15 | –0.16 | –0.15 |
| No. 1080 operations | 29.36 | 20.00 | 26.00 |
The forecast kiwi outcome with the 4-year prescriptive strategy was less favourable, with proportional population changes ranging from –0.04 to 0.01 (Table). This suggests that letting beech forest areas go 3 or more years without predator control will result in damaging predation rates and decreasing kiwi populations. The required twenty 1080 operations in this strategy was clearly insufficient to meet management objectives. The 3-year prescriptive strategy required 26 baitings of 1080 over 20 years and resulted in positive kiwi population growth in all management zones, but lower than that of the reactive strategy (see Table).
The forecast model provides an objective means to compare alternative broad-scale predator management strategies. The results of the modelling indicate that the best outcomes for kiwi result from a nimble management strategy that is reactive to annual stochasticity in masting and rat population density. The finding that kiwi population declines can be reversed with intensive management, but that growth rates are unlikely to meet the 2% SOIK goal, demonstrates that modelling can provide policy makers, management and the public with evidence-based expectations for favourable biodiversity outcomes as a result of predator management.
Dean Anderson
andersond@landcareresearch.co.nz
John Innes