Wielding power for pest control

Rabbit. © John Hunt
Consider this scenario: introduced predators, like ship rats, are responsible for dwindling numbers of North Island robins at Hamburger Hill Scenic Reserve. An aerial poison operation reduces rat numbers by an estimated 95%, and managers want to determine the response of the robin population to reduced predation. There is optimism that robin survival will have increased by 40%, but hopefully by at least 20%. Data are collected and statistical analyses are carried out. The results are disappointing because there is no statistical support for increased survival. However, is there a chance that survival did increase by 40% or 20% due to rat control, but the researchers simply had insufficient ‘statistical power’ to detect it?
Statistical power is the ability to detect a significant difference or effect when one is present. For example, if robin survival had actually increased by 40%, could this increase be detected with the sampling design used? Power analysis has been advocated for many decades to improve research designs and aid the interpretation of statistical results, yet it remains unfamiliar or misapplied. Doing an a priori power analysis (i.e. before a study begins) helps researchers estimate the number of samples necessary to detect a biologically significant effect if one has occurred.
Statistical power depends on three inter-related components: (1) sample size, (2) α, which is the significance level, and (3) effect size. Increasing any one of these always increases power, but α is generally set at 0.05 in order to reduce the chance of a type I error (which is rejecting a null hypothesis that is true). The least understood of these components, effect size, is critical for calculating power. For the robin example, the effect sizes are 40% and 20%, and an increase in robin survival of 40% would be easier to detect than an increase of only 20%. Prior to monitoring survival, a power analysis should have been done to determine the minimum number of samples needed to reliably (i.e. with high power) detect an increase of 20% or 40% survival.
The data necessary to conduct a power analysis can be obtained from previous research, from a pilot study, or from a range of biologically probable values. Such an analysis ensures resources are not wasted by carrying out studies that are too small to reliably answer managers’ questions. Here Cecilia Latham and Dave Latham use three local case studies to illustrate how statistical power analysis can be used to guide robust research and management.
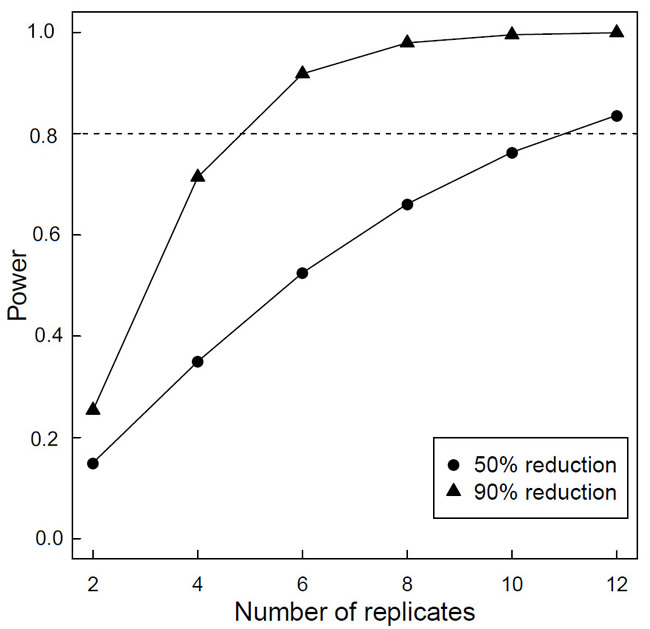
Rabbits are a long-standing pest of dryland pastures in New Zealand. A key method for controlling them is through aerially applied 1080 poison, and it is generally assumed that 1080 operations reduce rabbit numbers by 95% or more. While quantitative data have shown that this is achievable, the outcome of an operation is often based on a more qualitative assessment. Dave Latham, Graham Nugent and Bruce Warburton examined the efficacy of rabbit control by conducting a power analysis using data from a pilot study that assessed the accuracy of three methods (spotlight transects, vantage-point counts and camera traps) for monitoring rabbit relative abundance. Their key findings were that with moderate sampling intensity (either four 800 m spotlight transects, four vantage points, or six camera traps), all methods had good statistical power (83–95%) to detect large reductions in rabbit numbers (95%). There was, however, reduced power to detect smaller reductions (e.g. 50%); for camera traps, at least 12 units would be needed to reliably detect such an effect size (Figure 1).

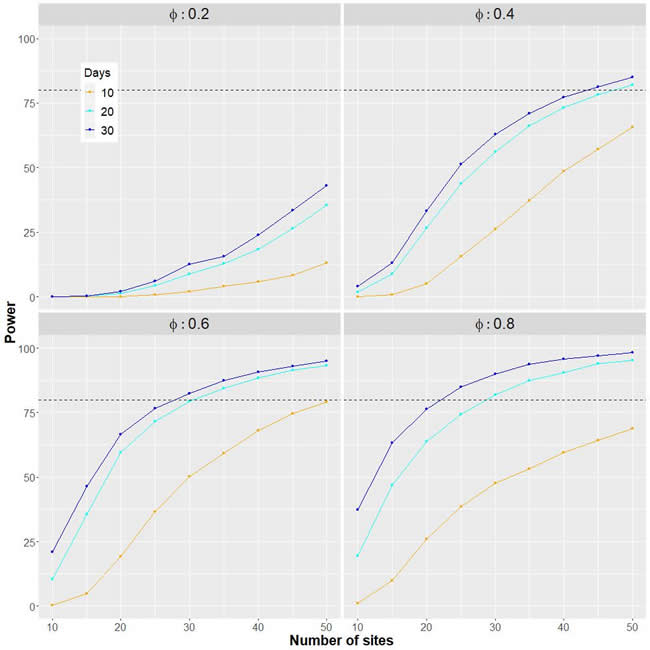
Programmes to control mammalian predators across an increasingly large part of New Zealand are becoming a management reality as more regional authorities commit to the Predator Free 2050 initiative. As in the rabbit example, data from control programmes should instil confidence that pest numbers have been meaningfully reduced following intervention. Predators generally occur at much lower densities than rabbits, and so they require a higher sampling intensity to have sufficient power to detect a similar level of reduction. Al Glen and Cecilia Latham assessed the sampling effort needed to detect a 90% reduction in the post-control probability of occurrence of stoats for the Taranaki Mounga Project. The results indicated that a minimum of 45 camera traps deployed for at least 20 days would provide sufficient statistical power (≥80%) to detect such reduction (Figure 2), but only if stoats initially occurred at 40% or more (φ ≥ 0.4) of the locations. However, if stoats were more sparsely distributed before control (φ < 0.4), statistical power would be correspondingly low, regardless of the sampling effort.

Being able to confidently detect positive changes in biodiversity assets resulting from predator control is paramount to demonstrating that money has been well spent and that pest animals were not killed unnecessarily. When monitoring biodiversity assets, however, managers aim to detect effect sizes that are typically much lower (c. 10–20%) than those expected for control operations. Accordingly, sample effort needs to be larger, and this can be achieved by either increasing the number of sample sites and/or the duration of monitoring.
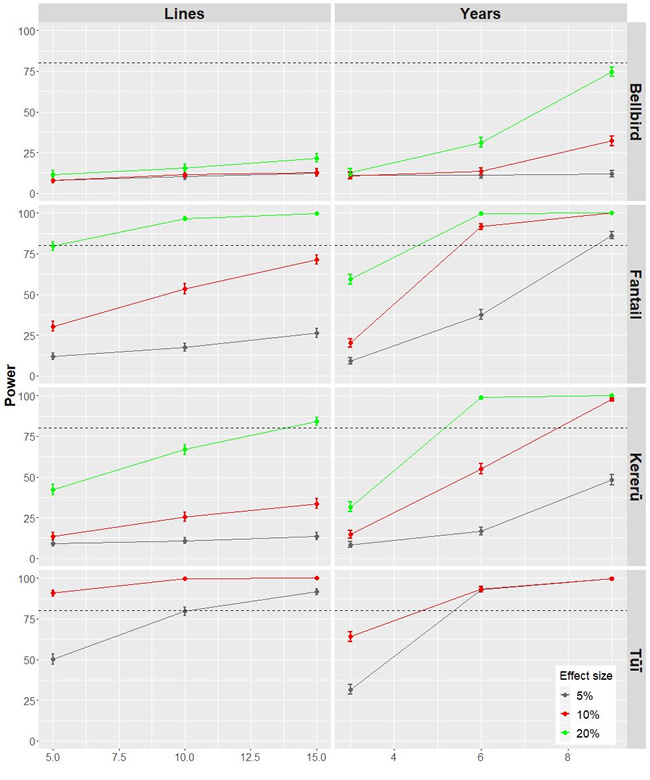
Cecilia Latham assessed these trade-offs by conducting a power analysis using 5-minute bird count data collected by Taranaki Regional Council around New Plymouth. The aim was to identify monitoring designs for the rural landscape between Mt Taranaki and the coast that would confidently detect annual increases of 5%, 10% or 20% in the probability of occurrence of native forest birds. The results indicated that for species like fantail and tūī, even the smallest effect size (5%) could be confidently detected after monitoring for a minimum of 9 years, whereas power to detect this effect size remained low for kererū (Figure 3). After 9 years, statistical power remained low for bellbirds irrespective of effect size. The number of years birds were monitored had a greater effect on statistical power than did the number of lines monitored (Figure 3).

Finding that some perturbation (such as predator removal) has had a statistically significant effect on the abundance or survival of their prey is not that informative: it is the magnitude of the effect caused by the removal and whether this is biologically significant that is important for wildlife management, conservation and adaptive management. An a priori power analysis is an important tool in this regard. It can inform the level of sampling intensity needed to detect a biologically meaningful effect, such as a sufficiently high level of robin survival to halt or reverse population decline. Cecilia and Dave recommend that statistical power analyses be done routinely to guide research planning.
This work was funded by Sustainable Farming Fund (Ministry of Primary Industries) and Taranaki Regional Council.
Cecilia Latham
arientic@landcareresearch.co.nz
Dave Latham
