EcoSat and LCDB
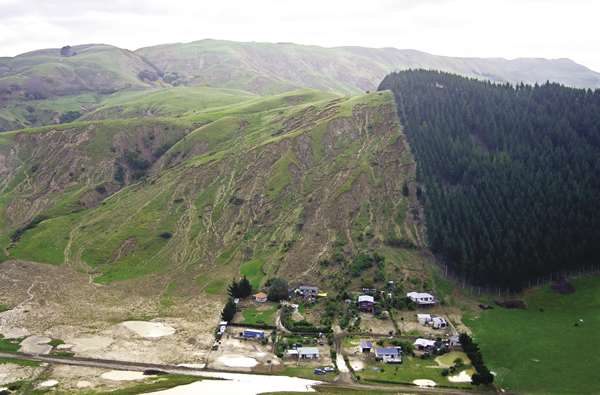
Severe erosion in southern Hawkes Bay following a major storm in 2011. Image - Les Basher
What is the difference between EcoSat and LCDB (Land Cover Database)?
The table below contrasts EcoSat with the LCDB. Although both systems use satellite imagery to produce land information at 1:50 000 scale, they are different in many aspects. LCDB was designed primarily to report on changes to land cover and therefore has needed to maintain the mapping standards established for the LCDB1 (e.g., 1 ha minimum mapping unit). EcoSat in contrast has been free to use new technology and develop different standards for a variety of products. These products have been designed to complement LCDB. For example, EcoSat basic land cover maps actual land cover, whereas LCDB focusses more on land use (e.g., recently cleared forest in an exotic forest estate is mapped by EcoSat as bare ground, whereas it is mapped by LCDB as exotic forest). EcoSat does not attempt to produce a single snapshot in time, like LCDB, but has built up a national coverage of ETM+ imagery over 4 years. Thus it has been possible to archive high quality imagery with relatively high sun angles and low cloud cover. The high sun angles have permitted the flattening of imagery and the automatic processing to products with 15-m pixel minimum mapping unit.
Summary table |
|
| EcoSat | LCDB2 |
| Products | |
|
|
| Minimum mapping unit | |
|
|
| Geo-registration accuracy | |
|
|
| Primary uses | |
|
|
| Production methods | |
|
|
| Acquisition period | |
|
|
| Distribution | |
|
|