Skip to main content
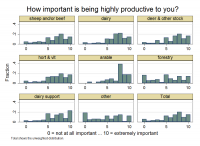
How important is being a highly productive farmer/forester/grower to who you are?
Note: 0 means “not at all important” and 10 means “extremely important”.
Data by primary land use
| Primary land use |
N |
mean |
sd |
min |
median |
max |
| sheep and/or beef |
694 |
6.523 |
2.753 |
0 |
7 |
10 |
| dairy |
327 |
7.034 |
2.341 |
0 |
7 |
10 |
| deer & other stock |
54 |
6.796 |
2.666 |
0 |
7 |
10 |
| hort & vit |
167 |
6.808 |
2.6 |
0 |
7 |
10 |
| arable |
47 |
7.681 |
2.012 |
1 |
8 |
10 |
| forestry |
124 |
5.194 |
3.399 |
0 |
5 |
10 |
| dairy support |
70 |
6.914 |
2.614 |
0 |
7 |
10 |
| other |
81 |
4.938 |
3.403 |
0 |
5 |
10 |
| Total |
1,564 |
6.535 |
2.787 |
0 |
7 |
10 |
Data by region
| Region |
N |
mean |
sd |
min |
median |
max |
| Auckland |
48 |
5.229 |
3.703 |
0 |
5.5 |
10 |
| Bay of Plenty |
84 |
7.298 |
2.099 |
0 |
8 |
10 |
| Canterbury |
278 |
6.655 |
2.67 |
0 |
7 |
10 |
| Gisborne |
38 |
6.789 |
2.858 |
0 |
7 |
10 |
| Hawke's Bay |
131 |
6.794 |
2.756 |
0 |
7 |
10 |
| Marlborough |
89 |
6.753 |
2.555 |
0 |
7 |
10 |
| Manuwatu-Whanganui |
104 |
6.308 |
2.923 |
0 |
7 |
10 |
| Northland |
83 |
6.096 |
2.908 |
0 |
7 |
10 |
| Otago |
200 |
6.66 |
2.838 |
0 |
7 |
10 |
| Southland |
134 |
7.194 |
2.299 |
0 |
8 |
10 |
| Tasman & Nelson |
105 |
5.533 |
3.079 |
0 |
6 |
10 |
| Taranaki |
67 |
6.552 |
2.619 |
0 |
7 |
10 |
| Waikato |
116 |
6.621 |
2.626 |
0 |
7 |
10 |
| Wellington |
56 |
6.089 |
3.26 |
0 |
7 |
10 |
| West Coast |
31 |
5.484 |
2.657 |
0 |
6 |
10 |
| Total |
1,564 |
6.535 |
2.787 |
0 |
7 |
10 |


