Skip to main content
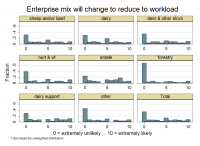
How likely is it that you will change the land use mix to reduce your workload in the next 5 years?
How likely do you think the following is to happen in the next 5 years? The enterprise mix will be changed to reduce your workload
Note: 0 means “extremely unlikely” and 10 means “extremely likely”.
Data by primary land use
| Primary land use | N | mean | sd | min | median | max |
|---|
| sheep and/or beef | 669 | 3.747 | 3.404 | 0 | 3 | 10 |
| dairy | 321 | 3.695 | 3.279 | 0 | 3 | 10 |
| deer & other stock | 53 | 3.698 | 3.511 | 0 | 3 | 10 |
| hort & vit | 156 | 3.538 | 3.646 | 0 | 2 | 10 |
| arable | 47 | 4.511 | 3.507 | 0 | 5 | 10 |
| forestry | 113 | 1.823 | 3.14 | 0 | 0 | 10 |
| dairy support | 69 | 4.232 | 3.777 | 0 | 3 | 10 |
| other | 79 | 2.873 | 3.477 | 0 | 1 | 10 |
| Total | 1,507 | 3.569 | 3.452 | 0 | 3 | 10 |
Data by region
| Region | N | mean | sd | min | median | max |
|---|
| Auckland | 44 | 2.932 | 3.725 | 0 | 1 | 10 |
| Bay of Plenty | 80 | 3.95 | 3.356 | 0 | 4 | 10 |
| Canterbury | 278 | 3.734 | 3.557 | 0 | 3 | 10 |
| Gisborne | 37 | 3.676 | 3.3 | 0 | 4 | 10 |
| Hawke's Bay | 118 | 3.415 | 3.47 | 0 | 2 | 10 |
| Marlborough | 85 | 2.847 | 3.065 | 0 | 2 | 10 |
| Manuwatu-Whanganui | 100 | 3.18 | 3.28 | 0 | 2 | 10 |
| Northland | 80 | 3.862 | 3.606 | 0 | 3.5 | 10 |
| Otago | 191 | 3.424 | 3.36 | 0 | 3 | 10 |
| Southland | 134 | 3.731 | 3.414 | 0 | 3 | 10 |
| Tasman & Nelson | 98 | 3.969 | 3.8 | 0 | 4 | 10 |
| Taranaki | 65 | 3.585 | 3.544 | 0 | 4 | 10 |
| Waikato | 116 | 3.457 | 3.505 | 0 | 2 | 10 |
| Wellington | 52 | 3.654 | 3.452 | 0 | 3 | 10 |
| West Coast | 29 | 4.138 | 2.774 | 0 | 5 | 10 |
| Total | 1,507 | 3.569 | 3.452 | 0 | 3 | 10 |


