Skip to main content
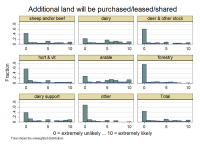
How likely is it that you will purchase or lease additional land in the next 5 years?
How likely do you think the following is to happen in the next 5 years? You will purchase, lease, or share farm additional land
Note: 0 means “extremely unlikely” and 10 means “extremely likely”.
Data by primary land use
| Primary land use | N | mean | sd | min | median | max |
|---|
| sheep and/or beef | 669 | 3.054 | 3.449 | 0 | 2 | 10 |
| dairy | 321 | 4.536 | 3.351 | 0 | 5 | 10 |
| deer & other stock | 53 | 2.057 | 3.213 | 0 | 0 | 10 |
| hort & vit | 156 | 1.949 | 3.007 | 0 | 0 | 10 |
| arable | 47 | 4.532 | 3.599 | 0 | 5 | 10 |
| forestry | 113 | 1.027 | 2.127 | 0 | 0 | 10 |
| dairy support | 69 | 3.377 | 3.746 | 0 | 1 | 10 |
| other | 79 | 1.127 | 2.204 | 0 | 0 | 10 |
| Total | 1,507 | 3.028 | 3.431 | 0 | 1 | 10 |
Data by region
| Region | N | mean | sd | min | median | max |
|---|
| Auckland | 44 | 2.205 | 3.137 | 0 | 0 | 10 |
| Bay of Plenty | 80 | 2.563 | 3.142 | 0 | 1 | 10 |
| Canterbury | 278 | 3.482 | 3.721 | 0 | 2 | 10 |
| Gisborne | 37 | 3.162 | 3.579 | 0 | 2 | 10 |
| Hawke's Bay | 118 | 2.941 | 3.225 | 0 | 2 | 10 |
| Marlborough | 85 | 2.6 | 3.186 | 0 | 1 | 10 |
| Manuwatu-Whanganui | 100 | 3.73 | 3.741 | 0 | 3 | 10 |
| Northland | 80 | 2.475 | 3.353 | 0 | 0 | 10 |
| Otago | 191 | 3.099 | 3.282 | 0 | 2 | 10 |
| Southland | 134 | 3.679 | 3.674 | 0 | 3 | 10 |
| Tasman & Nelson | 98 | 1.327 | 2.697 | 0 | 0 | 10 |
| Taranaki | 65 | 3.231 | 3.234 | 0 | 2 | 10 |
| Waikato | 116 | 3.44 | 3.485 | 0 | 2 | 10 |
| Wellington | 52 | 2.25 | 2.714 | 0 | 0.5 | 8 |
| West Coast | 29 | 3.31 | 3.285 | 0 | 2 | 10 |
| Total | 1,507 | 3.028 | 3.431 | 0 | 1 | 10 |


