Skip to main content
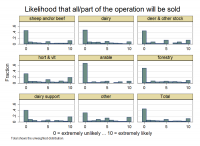
How likely is it that part or all of this operation will be sold in the next 5 years?
How likely do you think the following is to happen in the next 5 years? Part or all of the farm/forest/growing operation will be sold or subdivided
Note: 0 means “extremely unlikely” and 10 means “extremely likely”.
Data by primary land use
| Primary land use | N | mean | sd | min | median | max |
|---|
| sheep and/or beef | 669 | 3.018 | 3.686 | 0 | 1 | 10 |
| dairy | 321 | 2.57 | 3.288 | 0 | 1 | 10 |
| deer & other stock | 53 | 3.34 | 3.828 | 0 | 2 | 10 |
| hort & vit | 156 | 4.301 | 3.937 | 0 | 4 | 10 |
| arable | 47 | 1.787 | 3.134 | 0 | 0 | 10 |
| forestry | 113 | 2.805 | 3.548 | 0 | 0 | 10 |
| dairy support | 69 | 3.623 | 3.993 | 0 | 2 | 10 |
| other | 79 | 4.025 | 3.683 | 0 | 4 | 10 |
| Total | 1,507 | 3.093 | 3.662 | 0 | 1 | 10 |
Data by region
| Region | N | mean | sd | min | median | max |
|---|
| Auckland | 44 | 4.045 | 4.057 | 0 | 3 | 10 |
| Bay of Plenty | 80 | 3.487 | 3.865 | 0 | 2 | 10 |
| Canterbury | 278 | 2.842 | 3.646 | 0 | 1 | 10 |
| Gisborne | 37 | 2.405 | 3.278 | 0 | 0 | 10 |
| Hawke's Bay | 118 | 2.983 | 3.789 | 0 | 1 | 10 |
| Marlborough | 85 | 2.635 | 3.565 | 0 | 0 | 10 |
| Manuwatu-Whanganui | 100 | 2.62 | 3.357 | 0 | 0.5 | 10 |
| Northland | 80 | 4.162 | 3.689 | 0 | 4.5 | 10 |
| Otago | 191 | 3.021 | 3.466 | 0 | 1 | 10 |
| Southland | 134 | 3.246 | 3.678 | 0 | 1.5 | 10 |
| Tasman & Nelson | 98 | 3.622 | 3.983 | 0 | 2 | 10 |
| Taranaki | 65 | 2.769 | 3.287 | 0 | 1 | 10 |
| Waikato | 116 | 2.966 | 3.728 | 0 | 1 | 10 |
| Wellington | 52 | 3.288 | 3.937 | 0 | 1 | 10 |
| West Coast | 29 | 3.172 | 3.496 | 0 | 2 | 10 |
| Total | 1,507 | 3.093 | 3.662 | 0 | 1 | 10 |


