Skip to main content
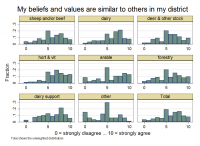
My beliefs, attitudes, and values toward developing my farm/forest/growing operation and my management practices are very similar to those of other farmers/foresters/growers in my local district.
How much do you agree with the following statement? Please indicate your answer on a scale of 0 to 10, where 0 means "strongly disagree" and 10 means "strongly agree". My beliefs, attitudes, and values toward developing my farm/forest/growing operation and my management practices are very similar to those of other farmers/foresters/growers in my local district.
Note: 0 means “strongly disagree” and 10 means “strongly agree”.
Data by primary land use
| Primary land use | N | mean | sd | min | median | max |
|---|
| sheep and/or beef | 694 | 5.905 | 2.545 | 0 | 6 | 10 |
| dairy | 327 | 6.303 | 2.445 | 0 | 7 | 10 |
| deer & other stock | 54 | 5.852 | 2.483 | 0 | 6 | 10 |
| hort & vit | 167 | 6.796 | 2.283 | 0 | 7 | 10 |
| arable | 47 | 6.021 | 3.047 | 0 | 6 | 10 |
| forestry | 124 | 5.823 | 2.666 | 0 | 6 | 10 |
| dairy support | 70 | 6.071 | 2.544 | 0 | 6.5 | 10 |
| other | 81 | 4.556 | 2.784 | 0 | 5 | 10 |
| Total | 1,564 | 6.016 | 2.569 | 0 | 6 | 10 |
Data by region
| Region | N | mean | sd | min | median | max |
|---|
| Auckland | 48 | 5.813 | 2.958 | 0 | 5.5 | 10 |
| Bay of Plenty | 84 | 6.774 | 2.203 | 0 | 7 | 10 |
| Canterbury | 278 | 6.173 | 2.684 | 0 | 7 | 10 |
| Gisborne | 38 | 6.421 | 2.139 | 3 | 6 | 10 |
| Hawke's Bay | 131 | 5.977 | 2.432 | 0 | 6 | 10 |
| Marlborough | 89 | 6.169 | 2.621 | 0 | 7 | 10 |
| Manuwatu-Whanganui | 104 | 5.885 | 2.608 | 0 | 6 | 10 |
| Northland | 83 | 5.59 | 2.59 | 0 | 5 | 10 |
| Otago | 200 | 5.88 | 2.667 | 0 | 6 | 10 |
| Southland | 134 | 5.903 | 2.563 | 0 | 6 | 10 |
| Tasman & Nelson | 105 | 5.629 | 2.672 | 0 | 5 | 10 |
| Taranaki | 67 | 6.045 | 2.596 | 0 | 7 | 10 |
| Waikato | 116 | 6.259 | 2.392 | 0 | 7 | 10 |
| Wellington | 56 | 5.607 | 2.294 | 1 | 5 | 10 |
| West Coast | 31 | 6.129 | 2.349 | 1 | 6 | 10 |
| Total | 1,564 | 6.016 | 2.569 | 0 | 6 | 10 |


