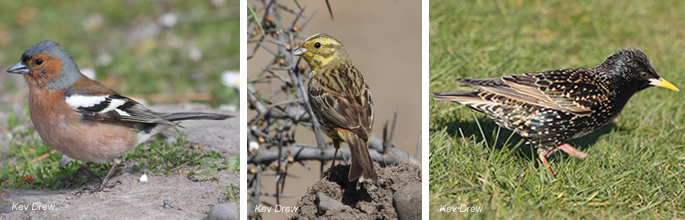
Trends in garden bird survey participation
Here, we explore how participation rates differ and change over time. We look at national trends as well as trends within and among regions.
Participation trends provide useful insights
Trends in participation can vary in the following ways:
- The number of gardens surveyed
- The location of gardens surveyed
- The composition of gardens surveyed
Understanding trends in participation is important to help:
- Interpret the observed trends in garden birds. Failure to do so could lead to non-representative or misleading results.
- Inform future strategies to improve participation rates and the quality of data collected.
National trends in garden numbers
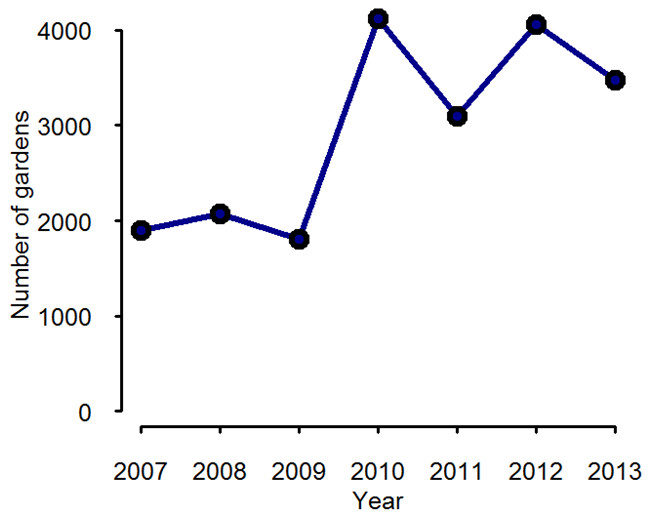
National trends in garden numbers
Every winter since 2007, New Zealanders have recorded birds visiting their gardens. Until 2010, about 2000 gardens were surveyed each year. Since then 3000 to 4000 gardens have been surveyed each year, which is equivalent to 0.19% of all New Zealand households (i.e. less than 2 in 1000).
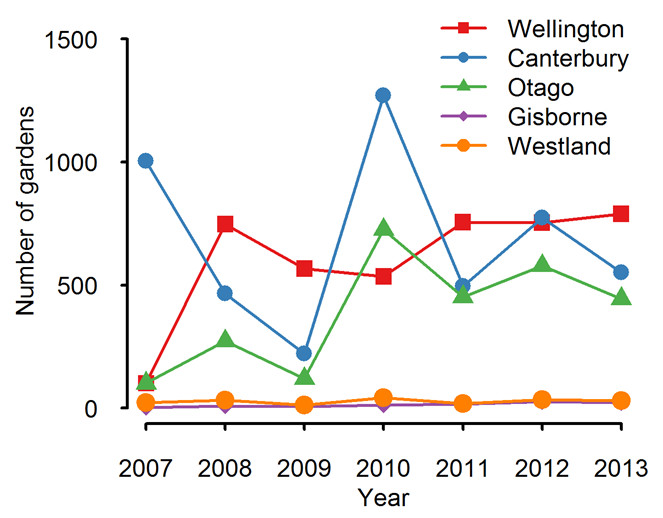
Regional trends in garden numbers
Regional trends in garden numbers
The number of gardens surveyed varies widely among regions. Some regions have hundreds of participants each year (Canterbury, Otago and Wellington), whilst others have very low numbers (Gisborne and Westland).
Within regions, there are also often large fluctuations in the number of gardens surveyed. In Canterbury, for example, garden numbers increased six-fold in 2010, but then dropped down again to <500 gardens in recent years.
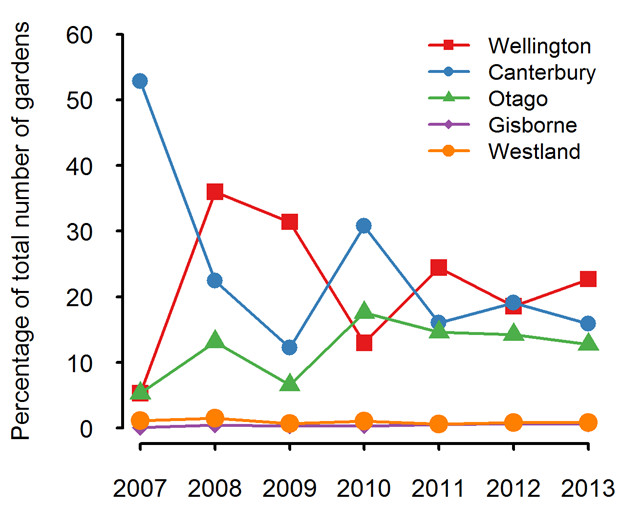
Regional contribution to the survey
Regional contribution to the survey
Does each region’s percentage contribution to the total number of gardens remain stable over time?
Percentage contributions from some regions are relatively stable (e.g. Gisborne and Westland). For other regions, contributions are highly variable. Canterbury, for example, made up 53% of the survey gardens in 2007 but only 16% in 2013, while Wellington rose from 5% in 2007 to 35% in 2008.
Are all regions equally represented?
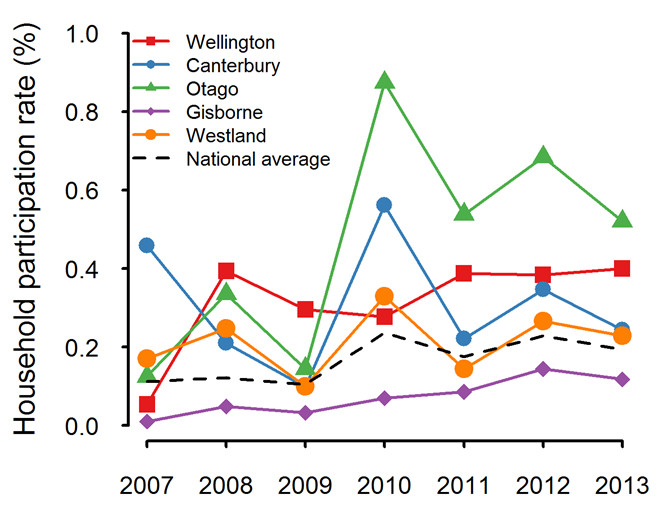
Are all regions equally represented?
National participation rates have almost doubled from 0.11% of households in 2007 (just over 1 in 1000) to 0.19% in 2013 (just under 2 in 1000).
Participation rates vary among the regions.
- Some regions are much higher than average. Otago and Wellington, for example, have participation rates >0.4%.
- Others are much lower. In Gisborne, for example, participation rates are <0.1%.
Some regions may have an above average participation rate, but still have low numbers of participants. For example, Westland had a participation rate of >0.2% in 2013, but due to its small population base this equates to just 30 participants.
Getting a representative picture within a region
In general, the greater the number of participants within a region, the more confidence there is that the results give a representative picture of the region.
Some regions have very low numbers of participants. For example, there were only 30 surveys from Westland in 2013 compared to 551 from Canterbury. We would therefore be more confident in results from Canterbury than from Westland despite similar participation rates (0.2%).
Table 1: Number of respondents in the Garden Bird Survey by year and region, ordered by most to least number of respondents in 2013.
| Region | 2007 | 2008 | 2009 | 2010 | 2011 | 2012 | 2013 |
|---|---|---|---|---|---|---|---|
| Wellington | 101 | 747 | 567 | 535 | 756 | 753 | 789 |
| Auckland | 227 | 66 | 261 | 460 | 378 | 793 | 654 |
| Canterbury | 1003 | 465 | 221 | 1270 | 496 | 774 | 551 |
| Otago | 101 | 273 | 119 | 725 | 452 | 578 | 444 |
| Waikato | 109 | 86 | 67 | 144 | 151 | 215 | 206 |
| Manawatu-Wanganui | 59 | 106 | 122 | 136 | 169 | 178 | 188 |
| Hawkes Bay | 15 | 39 | 137 | 137 | 175 | 157 | 138 |
| Bay of Plenty | 61 | 28 | 53 | 133 | 91 | 128 | 106 |
| Northland | 32 | 16 | 79 | 189 | 91 | 125 | 92 |
| Nelson | 28 | 20 | 12 | 49 | 66 | 63 | 63 |
| Marlborough | 38 | 134 | 68 | 115 | 64 | 63 | 62 |
| Tasman | 49 | 22 | 27 | 77 | 74 | 83 | 57 |
| Taranaki | 18 | 15 | 23 | 44 | 62 | 50 | 44 |
| Southland | 33 | 16 | 30 | 54 | 32 | 35 | 30 |
| Westland | 22 | 32 | 13 | 43 | 19 | 35 | 30 |
| Gisborne | 2 | 9 | 6 | 13 | 16 | 27 | 22 |