Highlights
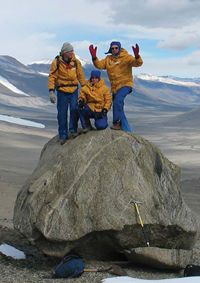
Soil scientists in the dry valleys of the Ross Sea Region of Antarctica. Image - M Balks
Impact 1: The status and trends of land resources and ecosystem services (including their interactions) are known and understood.
The National Land Cover Database (LCDB)
Landcare Research was commissioned to deliver two new editions of the Land Cover Database (LCDB) alongside a parallel research programme to develop improved ways of generating land cover information from satellite imagery. The LCDB series is a significant and authoritative resource of national land cover data and one of only a few datasets providing data at approximately 5-yearly intervals for describing change. It underpins state of environment monitoring, forest and shrubland inventory, biodiversity assessment, trend analysis and infrastructure planning, making it an invaluable tool for policymakers and land managers. Recent work has focused on improving data reliability and the technology for their delivery. The LCDB Governance Body comprises MBIE, MfE, LINZ, DOC, MPI and regional councils).
Version 3 (LCDB3) was released in July 2012 – a highly significant achievement that has been eagerly awaited by many stakeholders. LCDB3 maps land cover as at 2008. It includes new satellite data acquired during 2008/09; corrections for earlier errors; improved line-work representations; and responds to the needs of regional councils, territorial authorities and DOC. The project has also attracted the attention of Korean scientists and politicians looking to establish national datasets to facilitate climate change mitigation and reporting in Korea.
LCDB4 will be derived from 2012 remote sensing data. The goal is that by 2015 end-users will have access to a well-established series of LCDB editions that provide the authoritative record of land cover and land cover change in New Zealand.
http://lris.scinfo.org.nz
This work was supported by MBIE contestable funding, with considerable in-kind support from DOC and regional councils.
S-map Online
Soils are inherently variable. Knowledge of this variability enables fine-tuning of land and water management for economic gain and more sustainable resource use. Our S-map database was updated throughout the year – funding from Envirolink and regional councils allowed coverage to be extended in areas of the Wairarapa, Hawke’s Bay, Gisborne, Canterbury, and the West Coast.
S-map shows what soils occur where, and what their properties are. Soil variability significantly affects water storage, nutrient leaching and plant productivity, and S-map allows all this to be expressed as online maps. S-map also delivers soil information to a multitude of users (farmers, sector groups, consultants, government agencies) either directly to their geographic information systems or through our user-friendly portal, ‘S-map Online’. Accurate soil data underpin more sophisticated computer modelling, including the setting of reasonable water quality targets. S-map provides critical information to support nutrient management tools (such as Overseer), specialist crop calculators (such as for wheat and potatoes), and the dairy ef.uent soil risk calculator.
The dividends of tuning management to soil variability are exemplified by a catchment-scale case study in the Mataura Valley, which showed a cost–benefit ratio of 1:6 in the first year. Focusing mitigation practices on stony soils under dairy land use saved farmers $17 per kilogram of nitrogen (kgN) applied, and benefitted the community by $25 per kgN applied through reduced leaching to groundwater.
Knowledge of soil differences is also being used by some regional councils to set compliance regulations for irrigation scheduling. For example, Environment Waikato is investigating the use of soil water balance models for individual soil types to improve accuracy and allocation of freshwater consents for irrigation. Environment Canterbury also allocates freshwater consents for irrigation assisted by knowledge of the likely soil types and their available-waterholding capacities.
More »
This research was supported by Core funding, Envirolink, regional councils and other stakeholders.
Our Environment online
The past year has been a period of increased engagement with stakeholders, and improved access to our data and new information via several online ‘tools’. These easy-to use tools support improved monitoring and management of ecosystem services, soil conservation programmes, land use decision-making, and education. In addition to S-map Online, we launched Our Environment, which is another new web-based interactive application that draws on Landcare Research´s considerable holdings of environmental data. The application makes it possible to view maps, query features shown on the maps, and follow links to explanatory information. It covers landscape features (e.g. slope, aspect, erosion), land use capability (e.g. arable cropping, land-use intensification, production forestry), and ecosystems and habitats (e.g. vegetation types, threatened ecosystems and legally protected areas). The thematic focus is designed to make it easier for the general user although experts should find it of value too.
http://ourenvironment.scinfo.org.nz/
This work was supported by Core funding and provides access to Core-funded databases.
Environmental Domains for the Ross Sea Region of Antarctica
Landcare Research is working closely with Antarctica New Zealand and the New Zealand Antarctic science community to develop and refine an environmental classification for the Ross Sea Region of Antarctica. Developing the classification relies on collation of all available high-quality climate, ice cover, landform, geological, soil, and biological information. These data layers are then evaluated through the classification process (known as an environmental domains analysis) to generate a spatial classification that allows similar environments (including distinctive environments that are otherwise easily overlooked at the continental scale) to be grouped based on environmental character regardless of geographical location.
In addition, we are developing a geospatial data portal to ensure the data and classifications are accessible to all Antarctic stakeholders. The classification and data portal will improve Antarctica New Zealand’s ability to monitor, report, and manage the region and fulfil New Zealand’s obligations under the Protocol on Environmental Protection to the Antarctic Treaty.
This work is supported by MBIE contestable funding.
Impact 2: Opportunities and threats to land resources are recognised and balanced to maintain or enhance the provision of ecosystem services.
Maori Land Visualisation tool
Landcare Research has made steady progress on refining the prototype Maori Land Visualisation tool. This enables Maori land owners to gain a better understanding of the characteristics of their land assets and their potential use, and helps build knowledge and capacity to practice kaitiakitanga across their lands.
This year, the main focus has been further technical development (adding map layers and improving content) and creating a governance entity including representatives from Te Puni Kokiri (TPK), the Office of the Maori Trustee, Ministry of Justice and the Maori Land Court, LINZ and MPI. Governance issues include strengthening stakeholder engagement and support, where to ‘host’ the online tool, tailoring the tool to end-users, and developing a business model to seek long-term funding. The aim is to take the tool from a prototype model to a client-driven sustainablyfunded tool.
http://whenuaviz.landcareresearch.co.nz
This work was supported by TPK with some internal investment; some of the databases accessed are Core-funded.
Water quality issues for regions
Regional councils are charged with managing the cumulative effects of land use on water quality. In collaboration with Environment Canterbury, we have developed new tools to assist land managers in meeting water quality limits for the region.
In a simulated study, we showed that current methods and technology for measuring leachate under grazed pasture are woefully inadequate. Impractical numbers of measuring devices are required to accurately estimate average leaching from a field. This is of critical importance given this type of data is used by researchers to develop and evaluate farm-scale leaching models, and some regional councils are hoping to ensure compliance with nutrient discharge limits through such measurements.
The spatial model AquiferSim (developed with Lincoln Ventures) assesses the impact of potential land intensi.cation options on water quality in aquifers and spring-fed streams; this takes only minutes (rather than weeks as with more complex models). It can be used where geo-hydrological data are limited (good information is only available for a few aquifers in New Zealand). We tested AquiferSim in the Central Canterbury Plains (where there are good data) and in the Hurunui (where there are only poor data). This modelling work contributed to the Environment Canterbury’s Land Use and Water Quality Project, a collaborative process with stakeholders that resulted in the Hurunui and Waiau River Regional Plan. We are now working with Environment Southland to apply AquiferSim to the mid-Mataura Basin.
Our new spatial model of contamination risk at the regional scale draws on data in S-map and relevant research on contaminant pathways. This helps land managers determine where mitigation practices are needed, and enables regional councils to apply more appropriate consenting rules for effluent disposal and septic-tankdischarge fields. We used an updated regional nitrate-leaching map to provide statistics on the impact of nitrate thresholds being considered for the draft Canterbury Land and Water Regional Plan. We also developed a new method for allocating a catchment-scale nutrient limit between farms. This focuses on more intensive mitigation practices for land where there is a nitrate contamination problem, i.e. intensive land use on leaky soils in catchments known to have poor water quality.
More »
This research was supported by Core funding and Environment Canterbury.
National ecosystem services trends
Our economy and well-being rely on ecosystems and the services they provide, such as food and .bre, water regulation and pollination, recreation and tourism, and soil formation and nutrient cycling. We are undertaking research with a wide range of stakeholders to characterise the condition and trend of ecosystem services across all regions of New Zealand, and to look at how the full range of these services should be incorporated within decision-making on land use, development and management.
Several trends have emerged, highlighting areas for future research or policy focus.
- Ten percent of high class land in New Zealand is occupied by lifestyle blocks; 0.5% of high class land has been urbanised in the last 20 years
- Nitrate inputs to fresh water are increasing in Canterbury, the West Coast, and Southland. They are decreasing in Manawatu-Wanganui, Northland, Bay of Plenty, and Auckland. Elsewhere they are remaining the same
- Climate-regulation services provided by natural ecosystems are of a similar order of magnitude to fossil fuel emissions
- Over the last 20 years 51 000 ha of indigenous forest has been cleared and 71 000 ha of tussock grasslands has been converted to exotic pasture
We work with and report to a stakeholder group consisting of regional councils, MfE, MPI and DOC. On a one week-long tour of regional councils in the North Island, we presented our work on scaling up greenhouse gas emissions and carbon storage to national scale, and discussed our framework for assessing the impacts of land-use change on greenhouse gas and other ecosystem services. Regional councils are interested in the information for communicating, educating, reporting and monitoring following land-use changes.
More »
This research was supported by Core funding.
Important services from managed ecosystems |
Important services from natural ecosystems |
|
Food: crops, livestock, aquaculture |
Food: capture fisheries, wild foods |
|
Regulation: climate (global), water, erosion, pests, natural hazards, disease Water purification and waste treatment |
Regulation: climate (global), water, erosion, pests, natural hazards |
|
piritual and aesthetic values, sense of belonging |
Spiritual and aesthetic values, sense of belonging |
|
Soil formation and maintenance |
Soil formation and maintenance |