Summary of financial performance
Summary of group financial performance
| For year ended 30 June: | 2011 | 2012 | 2013 | 2013 | 2014 |
| Achieved | Achieved | Target | Achieved | Target | |
| Revenue, $m | 63.4 | 58.41 | 59.0 | 55.5 | 55.7 |
| EBIT before investment, $m | 3.9 | 3.3 | 3.3 | 2.2 | 2.2 |
| EBIT, $m | 2.9 | 2.22 | 1.6 | 0.8 | 1.5 |
| Investment, $m | 1.0 | 1.2 | 1.8 | 1.4 | 0.7 |
| Total assets, $m | 50.9 | 45.3 | 43.6 | 45.5 | 43.3 |
| Return on equity | 8.4%3 | 4.9% | 4.2% | 4.1%3 | 3.5% |
| Dividend $m | 0.7 | 1.1 | - | - | - |
| Equity ratio | 52% | 56% | 63%4 | 61% | 65%4 |
| Gearing | 13% | 0% | 0% | 0% | 0% |
| Interest cover | 31 | 47 | 1015 | 80 | 36 |
1 2012 Revenue achieved excludes Sirtrack, which was disclosed as a discontinued operation due to the sale of the business in November 2011.
2 2012 EBIT achieved excludes Sirtrack as this was disclosed as a discontinued operation as a result of the sale of the business in November 2011.
3 2011 and 2013 Return on equity excludes extraordinary restructuring costs.
4 2013 and 2014 Equity ratio target has been adjusted to calculate on averages rather than closing values (original SCI target 2013:64.1% and 2014 66.5%)
5 2013 Interest cover target has been adjusted to calculate on EBITDAF rather than EBIT (original SCI target 28.3)
Revenue:
Includes science research, subsidiaries, contract work for government and commercial clients, royalties, licence fees plus income from the sale of product and the lease of assets. It excludes income from gain on sale of subsidiaries and interest on investments and from finance leases, $0.1m for 2013 (2012: $0.9m).
EBIT:
Earnings before interest and tax, and after committed business development expenditure and commercialisation expenditure.
Return on equity:
NPAT ÷ average shareholders’ funds, expressed as a percentage. NPAT is net profit after tax. Shareholders’ funds include share capital and retained earnings.
Equity ratio:
Average shareholders’ funds ÷ average total assets.
Gearing:
Financial debt includes all interest-bearing liabilities. Gearing = interest bearing debt ÷ interest bearing debt plus shareholders’ funds, expressed as a percentage. (The Minister of Finance and the Minister of Science and Innovation each hold 50% of the shares on behalf of the New Zealand public.)
Interest cover:
Interest is the cost of debt and financial leases. Interest cover = EBITDAF ÷ interest. (EBITDAF is EBIT before depreciation, amortisation and fair value adjustments.)
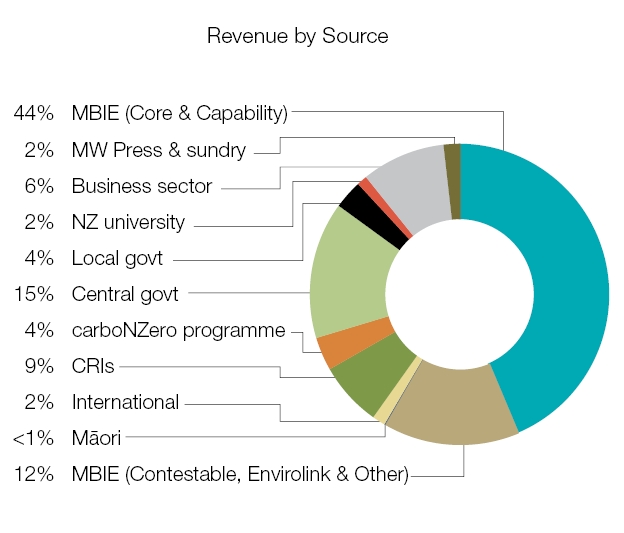
Where our revenue comes from
- Ministry of Business, Innovation and Employment’s (MBIE) Science + Innovation Group Core funding 44% – includes capability funding to maintain existing skill and to develop new science capability
- MBIE contestable funding sources 12%
- International 2% – development projects funded by donor agencies, international consultancy projects
- CRIs 9% – research subcontracted to us in collaborative programmes
- The carboNZero programmeCertTM 4% – which provides certification services for greenhouse gas reduction and mitigation
- Central government 15% – services contracted by government departments including DOC, MfE and MPI
- Local government 4% – contracted work for regional, district and city councils
- Universities 2% – contracted services, some paid lecturing by our staff, and rentals for university staff located in our buildings
- Private & business sector 6% – principally contracted work for businesses and industry organisations
- MW Press & sundry 2% – Manaaki Whenua Press is our natural history and science book publishing and retailing business centre
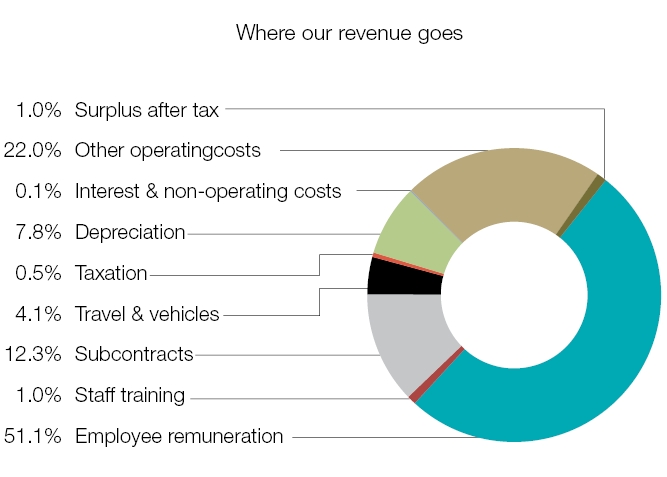
Where our revenue goes
- Employee remuneration 51.1% – includes staff in management, science, support roles, business development and carboNZero Holdings
- Staff training 1.0% – includes conferences, training courses and support for postgraduate study (2.49% of the total payroll)
- Subcontracts 12.3% – research subcontracted to other research providers, including CRIs and universities in collaborative research programmes
- Travel & vehicles 4.1% – all vehicle and air travel by our staff, including the cost of leased vehicles. Landcare Research runs a mixed fleet of vehicles including 4WD and quad bikes for .eldwork, and cars and vans for road use
- Depreciation 7.8% – includes accounting depreciation on buildings, science equipment and computers
- Other operating costs 22% – includes electricity, carbon credits, software licences, insurance, consumables, and lease costs