Land resources
Outcome: Sustainable use of land resources and the ecosystem services across catchments and sectors.
Land resources include the soil’s dynamic physical, chemical and biological ‘systems’, and the land cover, topography and hydrology. Land resources sustain primary production, ecosystem services (e.g., clean water, fertile soils) and the aesthetic benefits upon which New Zealand’s economy, tourism, identity and brand are based.
Effective management of land resources requires improved knowledge of their variability and change over time and across catchments and landscapes (natural, managed and urban), their response to human impacts, and potential environmental limits for land use intensification and other development. Improving knowledge assets will enhance policy development for land use and resource allocation; improve the economic and environmental performance of primary sector; and support government in meeting international reporting obligations. Our soils and land science capabilities are complemented by our informatics skills in accessing and analysing land information, and making it accessible in appropriate ways such as through mapping and geospatial visualisations.
The Government’s target of increasing exports from 30% to 40% of GDP will depend largely on research supporting a major lift in primary productivity. Such economic development opportunities must be achieved within environmental limits – through sustainable management of our land and water resources. The National Land Resource Centre (page 8) and the Productive Land Innovation Hub (the ‘Lincoln Hub’) (page 8) have critical roles to play in realising such opportunities and ensuring growth is ‘green growth.’
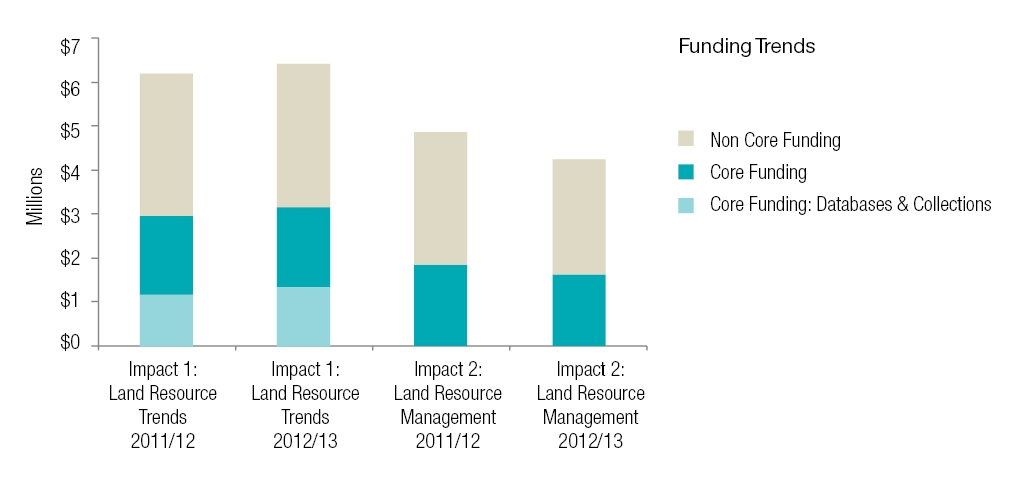
Impact 1: The status and trends of land resources and ecosystem services (including their interactions) are known and understood
KPI:
LCDB (land cover), LUDB (land use), S-map (soil) and ESDB (ecosystem services) components of LRIS (Land Resource Information System) have been enriched and are being used under the New Zealand Government Open Access Licensing framework for web-services.
2010/11 baseline situation:
Earlier versions of the land resource databases contained out-of-date information, with incomplete coverage for end-user needs, and with some barriers to open access.
Progress 2011/12:
- S-map Online now provides users with detailed spatial information to help fine-tune land management and technologies.
- Gisborne, Hawke’s Bay and Southland councils now have access to significantly improved S-map coverage of soil variability.
- An updated version of the Land Cover Database (LCDB), a thematic classification of land cover and land use (33 classes in LCDB v3.0), has been released.
- Where appropriate, information from our nationally-significant databases is available online under an open-licensing agreement.
Progress 2012/13:
- S-map coverage has been extended to include new areas in Waikato, Canterbury, Auckland and West Coast regions.
- Data updates and access improvements to the Soils Portal, S-map Online and the Land Resource Information System (LRIS) dramatically increased usage.
- LCDB has improved the accuracy of NZ’s 5-yearly National Forest Resource Assessment for submission to the FAO.
- End-users and stakeholders worked with us to finalise the roadmap for the future of LRIS and the Land Use Classification (LUC) system.
- Stakeholders and end-users are working with us to develop LCDB4.
- Semi-automated processing of high resolution imagery is being used in large mapping projects for MfE − the Land Use Map (LUM) for carbon and the LCDB series for multiple applications.
Impact 2: Opportunities and threats to land resources are recognised and balanced to maintain or enhance the provision of ecosystem services.
KPI:
Regional councils and the irrigation, pastoral, horticultural and arable sectors are using knowledge of soil variability to improve the match between land-use practices and land capability.
2010/11 baseline situation:
‘Ecosystem services’ modelling and decision-making were not widely applied by regional councils, and soil variability was generally only recognised at the landscape scale.
Progress 2011/12:
- Precision irrigation tuned to soil variability at the paddock scale achieved water savings of 20–36%, without any reduction in productivity, at three demonstration farms.
- Soil variability underpins the design and storage capacity of effluent management systems that comply with DairyNZ’s code of practice.
Progress 2012/13:
- Decision makers, irrigators and developers of land on stony soils have new evidence quantifying the risk of nutrients, microbes and other contaminants leaching to groundwater.
- Developers of the widely-used nutrient budgeting tool Overseer® will benefit from new data on soil properties and soil variability provided through S-map.
- Complex spatial land-use models predict optimal land use in two case studies, and assess impacts of irrigation scenarios on groundwater nitrogen for the Waimea Plains.
- Policy and planning to stabilise erosion-prone hill country benefit from modelling of future climate effects and new understanding of the ‘non-timber’ value of tree species for erosion mitigation.