Impact 1 - Trends
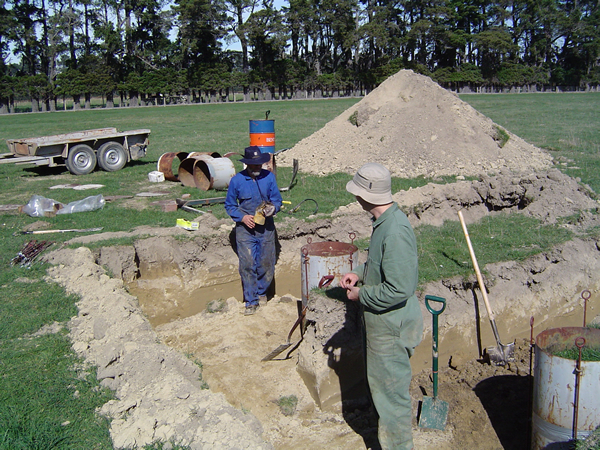
Lysimeter experiments to assess leaching under a dairy development scenario
The status and trends of land resources and ecosystem services (including their interactions) are known and understood.
S-map
Farmers and primary sector agencies need accurate on-farm and local-scale soils data for input into better water and nutrient management tools; local and central government need national-scale information to support policy and regulatory issues.
Smap Online coverage has been extended to include new areas in Gisborne, Waikato, Canterbury, Auckland, Bay of Plenty and the West Coast. We are collaborating with regional councils in Hawke’s Bay, Canterbury, Waikato and Auckland to further extend S-map coverage and improve interoperability with the Overseer® model for setting nutrient limits and land use planning.
Further development of S-map is in train with others in the sector, and this collaboration will support best management practices on-farm, enhance accuracy of soils data in the Overseer® model, as well as help develop national standards and protocols for farm-scale soil mapping.
S-map is part of the Characterising Land Resources portfolio, and was supported by Core funding and regional councils.
Stony soils
Despite demanding more water for productive use and being more prone to contaminant leaching, stony soils have become hotspots for land-use intensification. More information is urgently needed to assess the scale of the issue and to provide an evidence base supporting the development and implementation of appropriate land use policies. This year we undertook a national stocktake of the distribution, state of knowledge of, and agricultural development on New Zealand’s stony soils. Of the stony soils in New Zealand, 53% occur in Canterbury, 12% in Otago, 9% in each of Southland and the West Coast, with the remainder are distributed across the Tasman, Marlborough, Hawke’s Bay, Manawatu/Wanganui, and Wellington regions. Satellite images show that at least 196,000 ha of Canterbury’s stony soils are now under irrigation. In addition, 42% of stony soils have low phosphorus (P) retention (<30%), 77% have moderate to rapid permeability, and 58% have low water storage capacity (30–90 mm). These attributes are all indicators of soils with high vulnerability to nutrient and microbial leaching.
We also carried out lysimeter experiments to assess leaching of P, carbon (C), nitrogen (N), and microbes (E. coli) under a dairy development scenario on stony and very stony Canterbury soils. Initially we found large quantities of C and N in the leachate, and smaller but increasing levels of P. There was high E. coli leaching through very stony soils. Microbial leaching increased in some stony soils following hoof pugging. This work indicates that shallow groundwater may be vulnerable to nutrient and microbial contamination under some land-management practices on stony soils, especially where stones are close to the surface with a sandy soil matrix.
This research is part of both the Characterising Land Resources and Realising Land’s Potential portfolios, and was supported by Core funding and regional councils.
Remote sensing and data processing for mapping
New methodologies have been developed to increase the efficiency of map revision for MfE’s national Land Use Map (LUM). It will also be used in the upcoming Land Cover Database (LCDB4) project that provides very high-accuracy, national-scale imagery and databases for environmental management, spatial planning, economic modelling, to name just a few applications. When averaged across all of New Zealand and all classes, analysis of the third edition of LCDB (released June 2012) shows that we are achieving accuracies in excess of 96%. For the much smaller set of polygons that represent actual change between 2001 and 2008, the LCDB detects them with an accuracy in excess of 90%. The LUM is primarily used for national carbon reporting while the LCDB has a wide range of applications, including biodiversity monitoring, National Forest Resource Assessment reporting, and more accurate targeting of possum control operations (e.g., by AHB/TBfree New Zealand). The new methodologies have also been used to analyse changing land use patterns in central Canterbury, with a paddock-scale project demonstrating the value of an automated approach to regional councils.
This research is part of the Characterising Land Resources portfolio, and was supported by Core funding and MBIE contestable funding.
Soil biodiversity hotspots in Antarctica
Despite the extreme conditions, bacteria are distributed throughout soils of Antarctica and represent a major and important part of the biodiversity and ecosystem processes. The spatial distribution and composition of these microbial communities are strongly influenced by many soil attributes such as water content, salinity, organic carbon and pH.
Researchers combined field data from extensive soil sampling in Antarctica’s Dry Valleys and Environmental Chemistry Laboratory analyses of >500 samples with digital soil mapping techniques. From this, they were able to produce maps showing microbial habitats and biodiversity hotspots with very good spatial resolution (30 metres).
This represents a significant breakthrough in mapping microbial biodiversity in Antarctica’s vast, inaccessible and inhospitable landscape. Mapping microbial biodiversity is a prerequisite to monitoring impacts of climate change and to further studies of terrestrial Antarctic ecosystems.
The innovative approach was very well received when presented at a recent workshop to mark the inauguration of the New Zealand Antarctic Research Institute (NZARI), a charitable trust involving most Antarctic researchers in New Zealand.
This research is part of the Characterising Land Resources portfolio, and was supported by MBIE contestable funding with logistical support fromAntarctic New Zealand.
Antarctic soil vulnerability mapping
In the process of mapping the soils of Wright Valley, Antarctica, we developed a rapid method to determine (and hence map) soil vulnerability to human foot traffic. The research was used to inform discussions on soil vulnerability in the Dry Valleys at the CEP Antarctic Treaty Consultative Meeting in Brussels. The map will also aid the selection of walking routes, helicopter landing sites and campsites used by visitors – activities that can have very significant, long-term impacts on the fragile soils. Mapping has continued in the Victoria and Alatna valleys, Convoy Range, and Coombs and Alan hills.
This research is part of the Characterising Land Resources portfolio, and was supported by MBIE contestable funding with logistical support from Antarctic New Zealand.