Financial Performance Summary
Summary table of group financial performance
| 2014 | 2015 | 2016 | 2016 | 2017 | |
|---|---|---|---|---|---|
| Achieved | Achieved | Target | Achieved | Target | |
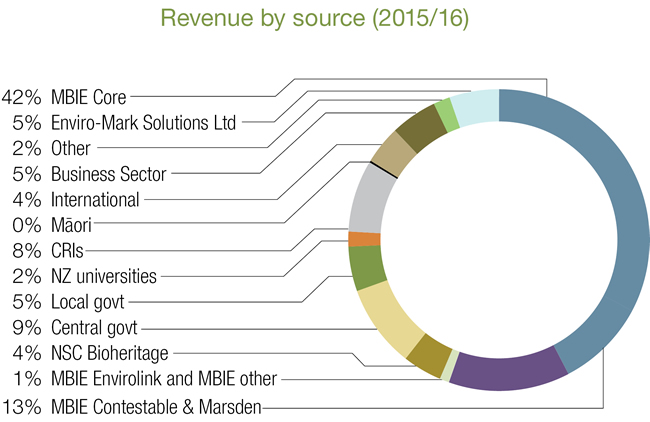
| Revenue, $m | 54.7 | 58.2 | 59.2 | 56.9 | 61.9 |
| EBIT before investment, $m | 3.6 | 3.0 | 3.0 | 3.4 | 2.0 |
| EBIT, $m | 2.9 | 2.2 | 2.1 | 2.8 | 1.3 |
| Investment, $m | 0.8 | 0.8 | 0.8 | 0.6 | 0.8 |
| Total assets, $m | 45.4 | 47.7 | 50.0 | 53.6 | 53.8 |
| Return on equity | 7.2% | 5.5% | 5.0% | 6.7% | 2.8% |
| Dividend $m | - | - | - | - | - |
| Equity ratio | 63% | 66% | 66% | 64% | 62% |
| Gearing | 0% | 0% | 0% | 0% | 0% |
| Interest cover | 658 | N/A | 614 | 336 | 34 |
NB: Revenue excludes income from interest on investments and from finance leases, $0.3m for 2016 (2015: $0.2m)


