Band Combinations and Wavelengths
Objects on the ground – buildings, vegetation, rock outcrops, water – reflect or interact with different wavelengths in different ways.
Multispectral data are composed of several different bandwidths of image data taken at the same time. Using these either alone or combined enables discrimination between many different cover and target types. Each image of Christchurch below is 20 x 20 km and has been resampled to 10-m pixels. Click images to enlarge.
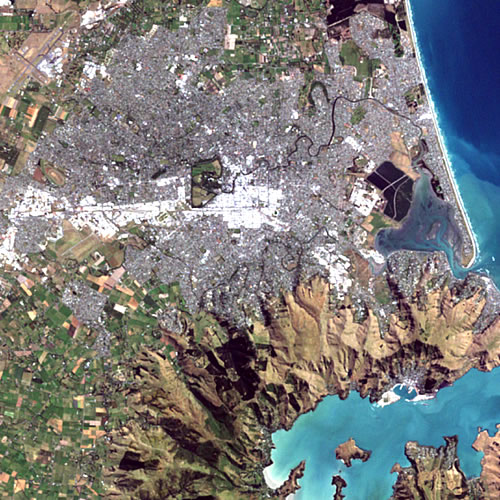 |
Visible wavelengths . Landsat 7 ETM bands 1,2,3 |
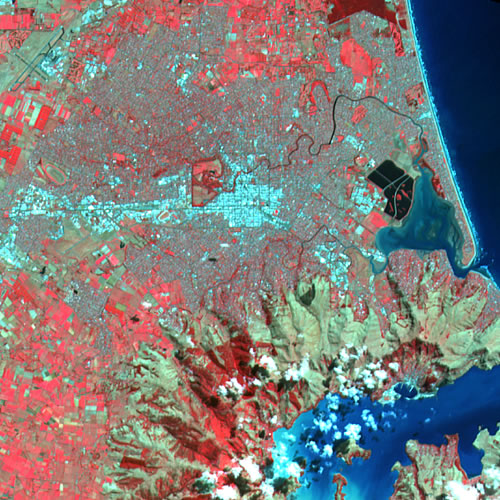 |
Visible and near-infrared wavelengths. Spot data bands 1,2,3 |
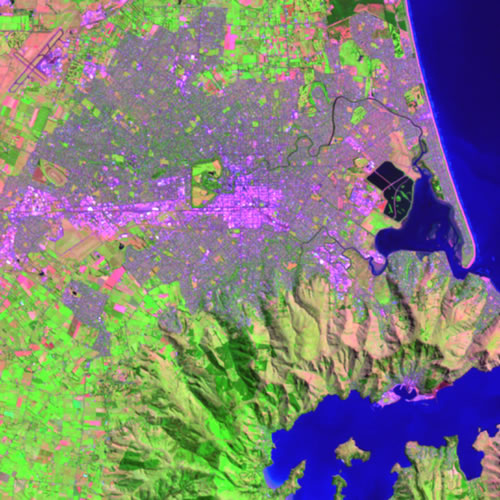 |
Visible, near- infrared and shortwave infrared wavelengths. Landsat 7 ETM bands, 2,4,7 |
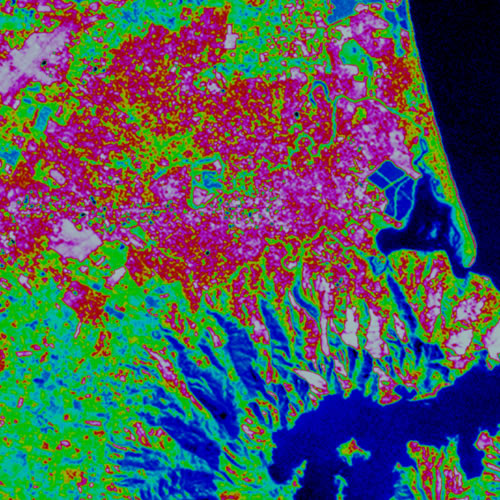 |
Thermal wavelength. Landsat 7 ETM band 6 colour-coded thermal data. |
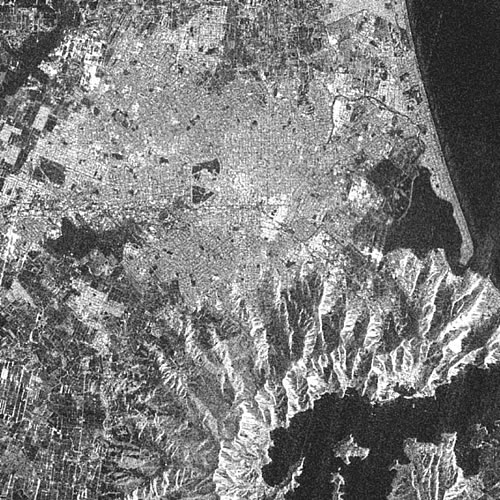 |
Radar wavelengths. Data courtesy of NASDA |
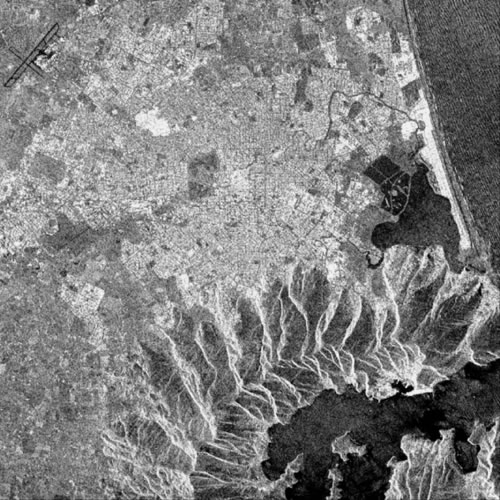 |
Radar wavelengths. © CSA 1999 |