Energy
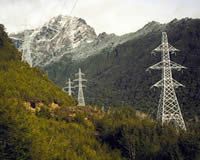
Pylons near Manapouri. Image – John Hunt.
In 2015/16, we used:
- A total of 3,557 million kWh (2% more than the previous year)
- Equivalent to 62,703 kWh per $million revenue
Energy includes electricity, reticulated gas and coal. Coal consumption relates to some parts of our Lincoln site that are still connected to the Plant & Food coal-fired boiler for heating.
Data for emissions and offsets excludes tenants sharing our Auckland, Palmerston North, Hamilton, Wellington, Lincoln and Dunedin sites. We do not record travel data for tenants or subsidiary staff, and energy consumption data is allocated pro-rata according to our staff / tenant staff ratios. Our subsidiary carboNZero Holdings is a tenant at our Lincoln site but occupy a different building in Auckland. The subsidiary company reports their environmental performance on their website. (On 1 July 2013 carboNZero Holdings merged with the Enviro-mark programme to become Enviro-Mark Solutions Ltd, a wholly-owned subsidiary.)
Electricity
Contributing factors to this year’s increased electricity use include:
- the discovery by Landcare Research's energy monitoring company of over consumption in the Fleming building at Lincoln. This was traced to the air handlers manual switch being activated which over rode their programming resulting in an additional consumption of 43,000 kWh. Once the switch was traced it was removed.
- server room requirements in Palmerston North continue to contribute significantly to that site's energy consumption. This will ease with future plans to move computing services to the cloud.
Gas
Reticulated gas is only used at our Palmerston North sites, where it is used primarily for heating. A small amount in used science laboratories.
Coal
The Godley Building and library at Lincoln are connected to Plant & Food Research’s coal-fired boiler for heating.
Energy-Efficiency Initiatives Include:
- Energy-measuring equipment and expertise has been adopted in our five main sites in collaboration with Energy Solution Providers (ESP).
- Solar lighting of external areas had been installed as part of the Insect Quarantine building, and together with significantly modernised plant and building design, the energy consumption dropped markedly compared to the old building.
- Lincoln, Auckland, Hamilton and Palmerston North have improved security of electricity supply through the installation of backup generators.
Energy Use
| Electricity | Reticulated Gas | Coal | Total Energy | |||||
| Year ending 30 June | kWh (000's) |
kWh per FTE |
kWh (000's) |
kWh per FTE |
kWh (000's) |
kWh per FTE |
kWh (000's) |
kWh per FTE |
| 1996 | 3171 | na | na | na | 501 | na | 3672 | na |
| 1997 | 2510 | na | na | na | 492 | na | 3002 | na |
| 1998 | 2380 | na | na | na | 484 | na | 2864 | na |
| 1999 | 2350 | na | na | na | 430 | na | 2780 | na |
| 2000 | 2350 | 6911.76 | 242 | 711.45 | 486 | 1428.80 | 3078 | 9052.02 |
| 2001 | 2250 | 6097.56 | 266 | 721.89 | 390 | 1057.82 | 2907 | 7877.27 |
| 2002 | 2362 | 5883.96 | 274 | 682.56 | 467 | 1163.34 | 3103 | 7729.87 |
| 2003 | 2316 | 5612.91 | 226 | 547.22 | 435 | 1053.63 | 2977 | 7213.76 |
| 2004 | 2405 | 6228.23 | 264 | 683.55 | 517 | 1338.61 | 3186 | 8250.39 |
| 2005 | 2687 | 7054.39 | 310 | 813.78 | 518 | 1359.81 | 3515 | 9227.97 |
| 2006 | 2796 | 7396.99 | 272 | 720.27 | 489 | 1293.54 | 3555 | 9405.00 |
| 2007 | 2565 | 7014.09 | 281 | 769.31 | 515 | 1407.76 | 3362 | 9191.16 |
| 2008 | 2752 | 7062.45 | 272 | 697.62 | 480 | 1232.22 | 3504 | 8992.29 |
| 2009 | 2831 | 7226.03 | 231 | 590.10 | 557 | 1422.13 | 3620 | 9238.26 |
| 2010 | 2925 | 7657.31 | 194 | 508.58 | 506 | 1323.32 | 3625 | 9489.20 |
| 2011 | 2568 | 6787 | 222 | 587 | 549 | 1451 | 3339 | 8824 |
| 2012 | 2724 | 5174 | 182 | 345 | 519 | 985 | 3424 | 6504 |
| 2013 | 2704 | 5416 | 150 | 301 | 359 | 719 | 3213 | 6436 |
| 2014 | 2853 | 6110 | 175 | 375 | 278 | 595 | 3306 | 7081 |
| 2015 | 2980 | 8639 | 170 | 390 | 341 | 780 | 3491 | 9810 |
| 2016 | 3078 | na | 149 | na | 329 | na | 3556 | na |
| % change from previous year | 3% | na | -12% | na | -3.5 | na | 2% | 10% |
The target for reduced energy usage is to aim for less than the past 5-year average or last year’s figure – whichever is lower.
Energy Target
| Total kWh (000s) | kWh per FTE | kWh (000s) per $m revenue | |
| 2008 | 3504 | 8992 | 62 |
| 2009 | 3620 | 9328 | 59 |
| 2010 | 3625 | 9489 | 58 |
| 2011 | 3326 | 8790 | 56 |
| 2012 | 3427 | 6504 | 61 |
| 2013 | 3132 | 8379 | 59 |
| 2014 | 3306 | 7080 | 63 |
| 2015 | 3492 | 9810 | 62 |
| 2016 | 3336 | na | 60 |
| 5 yr Average | 3363 | na | 59 |
| 2017 target | <3383 | na | <60 |