Monitoring erosion status of catchments
Digital map of landslides
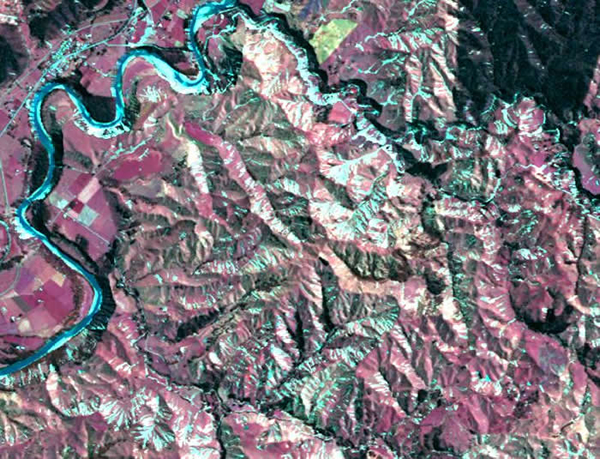
On 15 and 16 February 2004, a severe rainstorm hit the lower North Island of New Zealand, causing widespread landsliding and flooding. To assess the areal extent of landsliding, we acquired 6 SPOT5 satellite images shortly after the event, for The Ministry of Civil Defence and Emergency Management (MCDEM). SPOT5 has a sensor that acquires 10-m multi-spectral information in green, red, and near-infrared bands, and 20-m in a middle-infrared band. MCDEM wanted to obtain coverage of the damaged areas to provide information on the extent and severity of storm damage. The information will assist Government departments and local authorities in the recovery process.
There are tens of thousands of landslides. The fastest way to get objective information of the extent and severity of landsliding is to use automated image processing techniques. Manual interpretation would take a very long time to obtain quantitative information. Landcare Research has developed methods to remove the effect of topography from satellite imagery, so automated techniques can be used. Once processed to standardised reflectance, automated identification of landslides may be applied.
The output from this process is a digital map outlining the boundaries of all landslides in the imagery, at a scale of 1:25 000 (10-m pixels). The landslide boundaries comprise both erosion scars and debris tails. With a digital map of landslides, we are able to produce quantitative statistics on landsliding on any geographic basis (farm, district, land class, etc.).