Riparian zone mapping
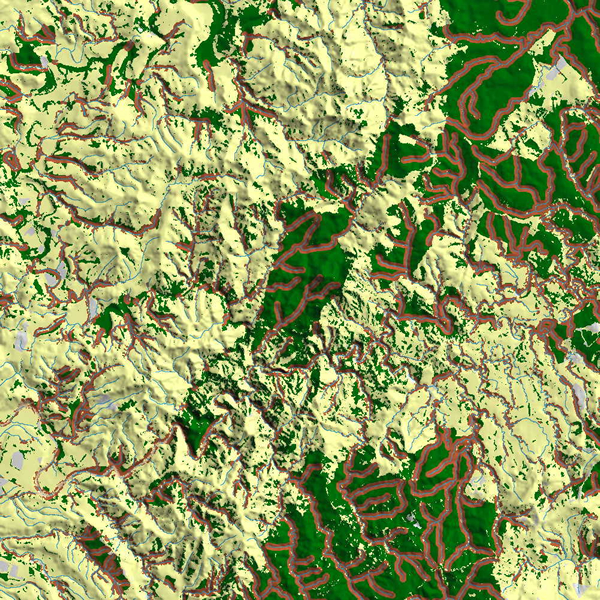
EcoSat riparian vegetation and watercourses in the Wairarapa. Woody vegetation in riparian zones is shown in brown. Other woody vegetation is shown in dark green. Pasture is yellow, bare ground is grey and watercourses are blue
Many regional councils in New Zealand now recognise the importance of riparian zones for water quality and are beginning to make plans to restore them. They also recognise the opportunity to enhance biodiversity values as well as water quality. There are, however, difficulties to overcome. The cost of restoration, which involves fencing and planting, over whole regions is prohibitive, so prioritisation of work is required. But where does one begin? The network of riparian zones in a region is usually enormous, and usually little is known about it.
The EcoSat project has developed an automated method for mapping riparian zones at 1:50 000 scale (i.e. 15-m pixels) over large areas. For the medium to large rivers, water and bare ground in the water courses are automatically mapped from Landsat ETM+ imagery. This is then combined with the stream network from the NZMS260 topographic maps to include small streams that cannot be seen in the imagery. The riparian zones are then mapped by buffering around all water courses. Intersecting the riparian zones with the basic land cover layer of EcoSat, also mapped at 15-m pixels, gives the vegetation status.
Because this information can be provided cost-effectively over large areas, it should be possible to gather sufficient information on riparian zones to develop initial prioritisation schemes. Scientists in the EcoSat project are developing methods for regional prioritisation of riparian restoration to maximise environmental benefits for dollars spent. They plan to start by calculating simple environmental indicators of pressure (proportion of catchment in pastoral land use) and response (proportion of riparian zones in woody vegetation); and eventually to use empirical models of sediment and solute transport to perform simple cost-environmental benefit analyses.