NOAA AVHRR

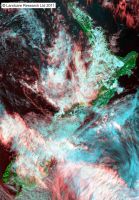
Typical NOAA image of New Zealand

One of the more cloud-free NOAA images of 2012

A relatively cloud-free NOAA image in 2009.
Description
HRPT (High Resolution Picture Transmission) AVHRR data was received directly from the NOAA-17, NOAA-16, and NOAA-15 satellites at Landcare Research's Lincoln site up to 26 December 2012. All of these NOAA satellites carry an AVHRR/3 instrument. This instrument has six bands, but only 5 are active at any one time. The additional band, 3a, is centered at 1.6 microns and during daylight hours (only in the case of NOAA-17 data) is used in place of the traditional 3.7 micron band 3 (now called 3b), which is used during the night and by the other NOAA satellites.Availability
NOAA operate their polar orbiting satellites in either a "morning" or an "afternoon" orbit. We received the two highest passes from the primary afternoon satellite (NOAA-16). One of these two passes is in the afternoon (2-4pm NZST), and other is at night time (1-3am NZST). Between October and March, when the sun angles are higher, we also collect the second highest afternoon pass. This pass may or may not be archived, depending on its coverage over the New Zealand land mass. We also received and archived the highest morning (9-11am NZST) pass from the primary morning satellite (NOAA-17), and the highest early-morning (6-8am NZST) and early-evening (7-9pm NZST) passes from NOAA-15.Processing
Daytime processing
For the NOAA-17 (and older NOAA-16 daylight images in the archive), a combination of AVHRR bands 1,2 and 3a are displayed as blue, green and red respectively. All three of these visible and near infrared channels are corrected for solar irradiance and calibrated to apparent top of atmosphere reflectance. After re-sampling to the New Zealand Metric Map Grid, a histogram equalisation enhancement is applied and a graphical coastline overlay added before the JPEG image is generated.
The effect of these steps is for vegetation to show up as reddish-brown through to dark green depending on type and condition. Forest is usually dark green, while actively growing grassland is bright green but can be reddish-brown in dry condition. The near-infrared band 3a gives improved separation between clouds and snow which appears blue.
For the NOAA-16 and NOAA-15 daylight images (and older NOAA-14 daytime images in the archive), a combination of AVHRR bands 1,2 and 4 are displayed as blue, green and red respectively. The visible and near infrared channels (1 and 2) are corrected as for NOAA-17. The 11 micron thermal band (4) is calibrated to brightness temperature and inverted so that black is warm and white is cold.
With this band combination, vegetation shows up as green and dense cold (high) clouds as white. Thin cirrus cloud, which is semi-transparent at visible wavelengths, appears red, while warmer low clouds will have a blue tint. Depending on ground temperatures, snow may also have a bluish tint. If the satellite orbit is close to dawn, the visible and near-infrared components (blue & green) may be lost towards the edge of the image giving a red appearance to the sea. If the sun angle gets below 2 degrees elevation, our algorithm sets those two components to zero leaving only the thermal (red) band.
Night time processing
For the NOAA-16 night time images, and those NOAA-15 images that were received outside daylight hours, AVHRR thermal bands 3b, 4 and 5 are displayed as blue, green and red respectively. All three bands are calibrated to brightness temperature and inverted so that black is warm and white is cold. After re-sampling to the New Zealand Metric Map Grid, a histogram equalisation enhancement is applied and a graphical coastline overlay added before the JPG image is generated.
The effect is a fairly grey thermal image, although different emissivities of the various cloud and ground surface types can show up as colour tints. The 3.7 micron (band 3b), displayed as blue, is sensitive to both emitted and reflected radiation. Images close to dawn or dusk may therefore be affected by sunlight which, as the IR bands are inverted, reduces the blue content causing a yellow tint, especially for higher cloud.
