S-map 2014 and beyond
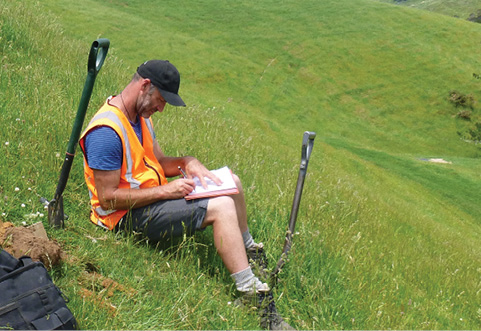
Scott Fraser assessing soils (David Palmer).
Sam Carrick
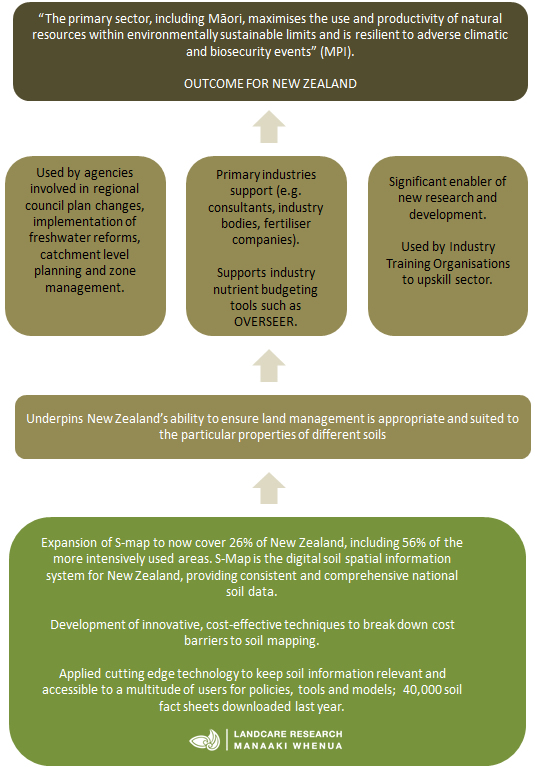
Accurate, accessible soil information is critical to New Zealand, which depends heavily on land-based biological resources for its wealth and well-being. Soil information is fundamental to both increasing primary productivity and managing the impacts of intensive land use on fresh water. Achieving both of these national priorities will depend on understanding the capabilities of different soils and being able to tune land management to their unique qualities.
As an example, a number of regions are investigating or developing large-scale irrigation schemes. Irrigation means intensive land use can expand into new areas. However, land management regimes that are inappropriate to the soil type can increase the contamination risk for groundwater, rivers, streams and lakes. Soil information is therefore a key requirement for regional councils that are implementing new policies and plans, setting limits on water quality and rules around the discharge of nutrients and contaminants from land. In addition, primary sector producers need high-quality, up-to-date and accurate soil information to optimise economic production while managing land within environmental limits.
Knowing what soils occur where
Basic measured characteristics
On the ground soil surveys collect information about the extent of particular soil types and their characteristics such as soil depth, soil texture, particle size and distribution. Laboratory analyses provide additional information about each soil type’s chemical and physical properties such as pH, nutrient availability and permeability. These basic data and laboratory measurements are all stored in the National Soils Database Repository, the next generation of the Core-funded National Soils Database (NSD). This type of soil mapping is time-consuming and requires expert knowledge combined with extensive fieldwork and data recording.
Extrapolating point data across the landscape
Experienced soil scientists (pedologists) at Landcare Research are able to extrapolate this basic ‘point data’ (the information collected at the sampling points) across the entire landscape by interpreting factors that affect soil formation (e.g. landform, climate, bed rock and geological processes). These techniques are helping to expand S-map coverage and the spatial information sits within the S-map database.
 S-map: the digital soil spatial information system for NZ
Although S-map is not yet complete for all of New Zealand, it provides the first consistent and comprehensive national soil data. Since its inception 10 years ago, S-map has incrementally evolved in response to changes in funding, technology development, and implementation of regional policies and end-user tools.
Despite accurate soil information being critical to the growth of our land-based primary industries, there has been limited funding for completing S-map coverage of New Zealand.
Innovative, cost-effective techniques to extend S-map
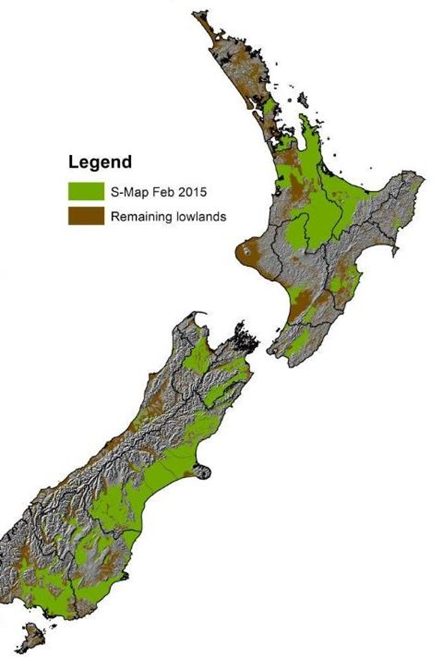
Considerable progress has been made over the last year thanks to our efforts in developing innovative, cost-effective, digital soil mapping (DSM) techniques. These techniques are proving highly valuable to mapping complex hilly land and steep lands, which represent three-quarters of New Zealand’s land area.
S-map now covers 26% of New Zealand, including 56% of the more intensively used areas. New mapping in 2014/15 included significant areas in Southland, Otago, Canterbury, Hawkes Bay and Waikato. Smaller areas in the West Coast, Wellington and Manawatu regions were also added.
An integrated information service
S-map 2014 is now considerably more than a map of what soils occur where. It is an integrated information system with the potential to store soil data at any scale, then ‘re-package’ this data into a wide array of information products to meet ever evolving end-user needs.
The functionality and usefulness of soil databases such as S-map are considerably enhanced by the inclusion of functional properties (such as water retention properties ‒ e.g. total available water, field capacity and wilting point) useful for determining land use, management/irrigation regimes and nutrient budgeting. These functional properties are considerably more laborious and expensive to measure so there is limited data available. However, high performance computing and techniques to mine the basic and laboratory soil data from the NSDR and other databases have opened up the potential for (and increased the accuracy of) predicting these difficult-to-measure functions. The resulting ‘pedotransfer functions’ or PTFs are key to enhancing the value and utility of soil data.
This complicated-sounding term refers to the process whereby key functional properties are predicted (transferred) from observed and more easily measured soil data. Various techniques (e.g. logical decision trees, mathematical modelling, multivariate statistical analyses) are used by our pedology and informatics staff to show how the functional properties relate to the basic data. PTFs generated using robust statistical analyses also provide a measure of uncertainty or confidence so that users know the degree to which they can trust the predicted data or what the limitations are.
We have invested in developing a significant new statistical model to estimate the soil Profile of Available Water (PAW). This is a key determinant of water storage so PAW data are essential to managing irrigation and nitrate leaching.
Delivering soil data to users
S-map data is delivered to end users in a variety of ways:
- S-map Online, the public access point to S-map data, which is very widely used by farmers and growers.
- A new ‘Business-to-Business’ web service, whereby computers ‘talk’ directly with each other in a common soils-computer language
- Data supplied directly to regional councils
S-map Online
 Users can explore interactive maps of soil properties, learn about soil variability, view detailed information about soil classes or attributes, and download soil factsheets that provide more detailed knowledge of soil properties and information relevant to a variety of potential uses, including nutrient budgeting. The factsheets are generated dynamically and describe the typical average properties of the specified soil type, and contain the wide range of soil attributes needed for Farm Environment Plans and nutrient budget models such as OVERSEER®. OVERSEER v6.2 (released in April 2015) specifies S-map Online as the source of this data.
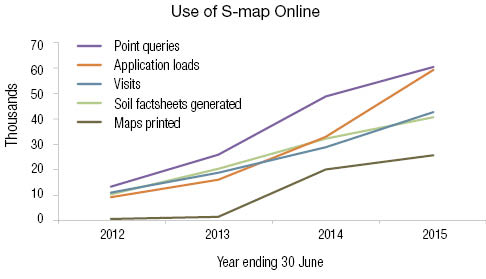
In the 3 years since its launch, S-map Online has had over 35,000 unique visitors, with visitor numbers increasing by 52% per annum and visits by 77% per annum. With visits growing faster than visitors, each visitor is getting more information from S-map online ‒ 100,000 soil fact sheets downloaded since launch, including over 40,000 fact sheets in the last year.
Visitors are primarily private sector (68% individuals/smaller businesses; 9% corporates such as Fonterra and Dairy NZ), followed by researchers/universities (20%). S-map Online is increasingly being used in university courses, e.g. during just one week, Lincoln University used S-map in 22 tutorials.
Business-to-Business systems ‘talking’ directly
Multiple soils often occur within a soil map unit; it requires expert skills to know how to enter this soil complexity into models such as OVERSEER. A solution is for the system to request the S-map data directly from the S-map bypassing the potential errors that can occur in manual translation from S-map factsheets.
In a recent Envirolink S-map tools project, we developed a new business-to-business (B2B) service that facilitates the direct transfer of S-map data to third party systems (e.g. OVERSEER) over the internet. In response to a request for a geo-referenced area, S-map provides data that is either stored in the S-map database or derived from running additional processing ‒ depending on what the customer wants.
Data to regional councils
S-map data for whole regions and catchments has been supplied to a number of regional councils, government agencies and large primary sector companies for use directly within their own in-house information systems.
S-map information is being used in the Canterbury Land and Water Regional Plan to set catchment and farm-scale limits. A new phosphorus loss risk map from S-map has been developed to assist the Canterbury Regional Council in identifying where additional good management practices might be required in order to minimise water quality issues. Similarly, S-map information is being used by Waikato Regional Council to set nutrient discharge allowances in the Rotorua Lakes area.