Transparent framework
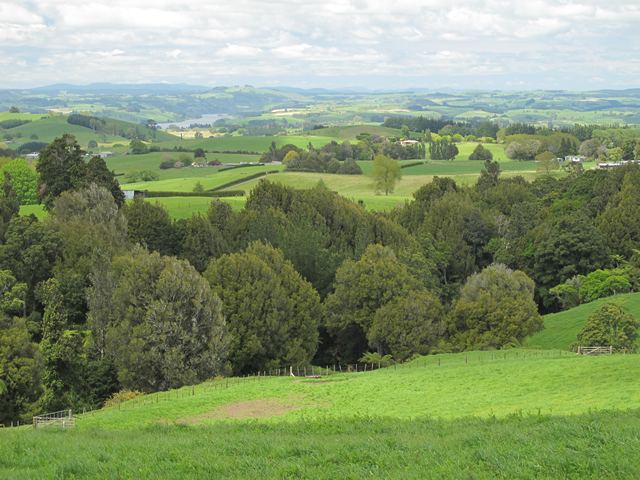
Example of farmland with different types and levels of woody vegetation cover.
Catriona MacLeod
Agricultural intensification represents an ongoing and increasing threat for biodiversity globally. In relation to this, consumers are increasingly seeking agricultural products that are produced sustainably. Agri-environmental schemes, designed to support farmers and industry bodies in gaining market access, often set biodiversity management targets. These target-setting processes typically have a subjective foundation such as expert opinion (e.g. from environmental consultants) or political pressure from key stakeholder groups. Other parties (e.g. non-government organisations (NGOs) advocating for better conservation and biodiversity management) often question these targets because the processes used to generate the targets are neither transparent nor repeatable.
Our solution: a transparent, evidence-based risk assessment framework
We developed a biodiversity risk assessment framework to provide stakeholders (e.g. industry bodies, policy makers, conservation NGOs) with a more transparent approach to identifying meaningful targets and action plans. The framework is based on the relationships between land management and biodiversity and the concept was developed and tested (proof-of-concept) using farmland bird populations as a model system.
Proof-of-concept
The proof-of-concept project investigated the effect of different land-use scenarios on bird biodiversity in agricultural landscapes. We used observations of 88 bird species (62 native and 26 exotic) from 13,665 survey sheets contributing to the 1999–2004 Atlas of Bird Distribution in the New Zealand Bird database. For each of the 3,138 grid cells (10 km × 10 km) of the Atlas, we also calculated the distribution of resources available to each species based on:
- Species’ specific diet, foraging strata and nesting site requirements
- Resources provided by each land cover class
- Availability of each land cover class derived from the Land Cover Database (LCDB2)
For each bird species, a model was constructed to quantify the relationship between the bird’s distribution (observed presence/absence in each of the grid cells) and the distribution of resource available to that species among the grid cells, having taken into account any variation in sampling effort among the grid cells.
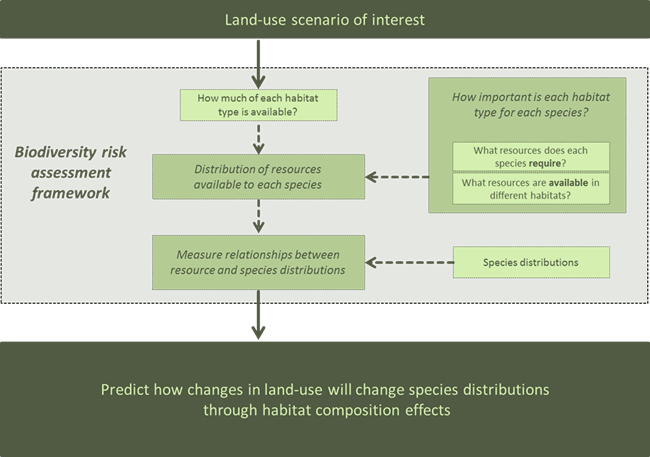
The final step in our analyses was to simulate land-use change scenarios to predict changes in bird species occupancy and richness on farmland at a national scale. Land-use scenarios were simulated for just the 1,276 farmland grid squares across New Zealand ‒ these being the 10 × 10 km squares with at least 50% farmland. Specifically, we focused on the effects of varying two features:
- the minimum cover of woody vegetation from 5% to 50% (increasing the cover in steps of 5%);
- the type of woody vegetation: exotic forest, native forest, native scrub and exotic scrub.
Native passerine1 occupancy increased markedly with increasing woody vegetation cover, while both non-passerine and exotic passerine (e.g. blackbird, chaffinch) occupancy decreased (but less so for exotic scrub cover).
The approach has generated sufficient information to underpin meaningful, national-scale woody vegetation targets for biodiversity gain on New Zealand farmland. For example, if the goal was to ensure an ‘indigenous dominance’ ratio (the ratio of mean native species richness to mean exotic species richness) of at least 2:1, then an estimated minimum of 15% woody vegetation land-cover per farmland grid cell would be required. The risk assessment framework capitalises on a range of existing data resources (in this case species atlas data, land cover information and the published literature) and integrates them in innovative ways to derive new value from those data, while also facilitating more efficient mechanisms for information use and sharing.
Potential issues of variable biodiversity responses (e.g. in relation to local climatic conditions) and context-dependency (e.g. distance to conservation land) still need to be taken into account. Nevertheless, the approach could be readily adapted to underpin different management actions for different taxa across a range of spatial scales.
Working with stakeholders to refine the framework
During the course of its development, this framework was discussed with a range of stakeholders, including industry partners involved in the New Zealand Sustainability Dashboard, the Regional Council Biodiversity Working Group and the Department of Conservation. This proof-of-concept is currently being piloted and refined with Greater Wellington Regional Council.
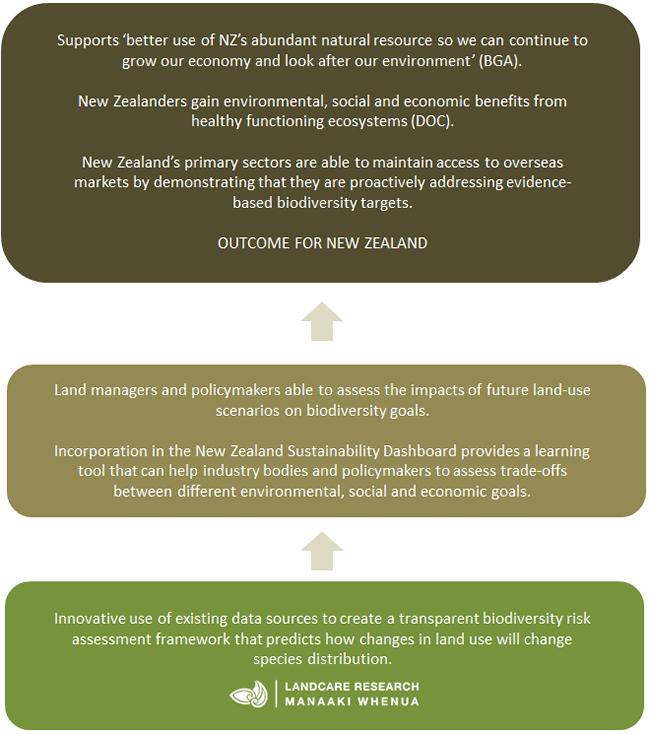
For the first time in New Zealand, multiple agencies and organisations are now implementing co-ordinated, consistent biodiversity monitoring and reporting systems to provide better information on biodiversity status and trends. As these systems generate new information, we will work with our stakeholders to test and update the underlying data sources and assumptions in the risk assessment framework. Specifically, the framework will support land managers and policymakers to assess the impacts of future land-use scenarios on biodiversity and ecosystem services, and hence identify better management targets.
The risk assessment framework is also being used in the MBIE-funded Building Trustworthy Biodiversity Indicators research programme, with a view to incorporating it into the New Zealand Sustainability Dashboard as a learning tool – helping industry bodies and policymakers to assess trade-offs among different environmental, social and economic goals.
Resources
A research summary outlining the framework structure has been published on the New Zealand Sustainability Dashboard project webpage.
Key research collaborators
- University of East Anglia (UK)
- Birds New Zealand
- Agricultural Research Group on Sustainability
- Greater Wellington Regional Council
1Passerines are birds in the order Passeriformes, which includes more than half of all bird species. Passerines are commonly called perching birds. Native passerines include species such as the fantail, silvereye, bellbird and pipit. Exotic passerines include species such as blackbirds, starlings, yellowhammer, chaffinch and skylark.